Immigrants from Ghana vs Iraqi Vision Disability
COMPARE
Immigrants from Ghana
Iraqi
Vision Disability
Vision Disability Comparison
Immigrants from Ghana
Iraqis
2.2%
VISION DISABILITY
8.9/ 100
METRIC RATING
213th/ 347
METRIC RANK
2.1%
VISION DISABILITY
67.7/ 100
METRIC RATING
161st/ 347
METRIC RANK
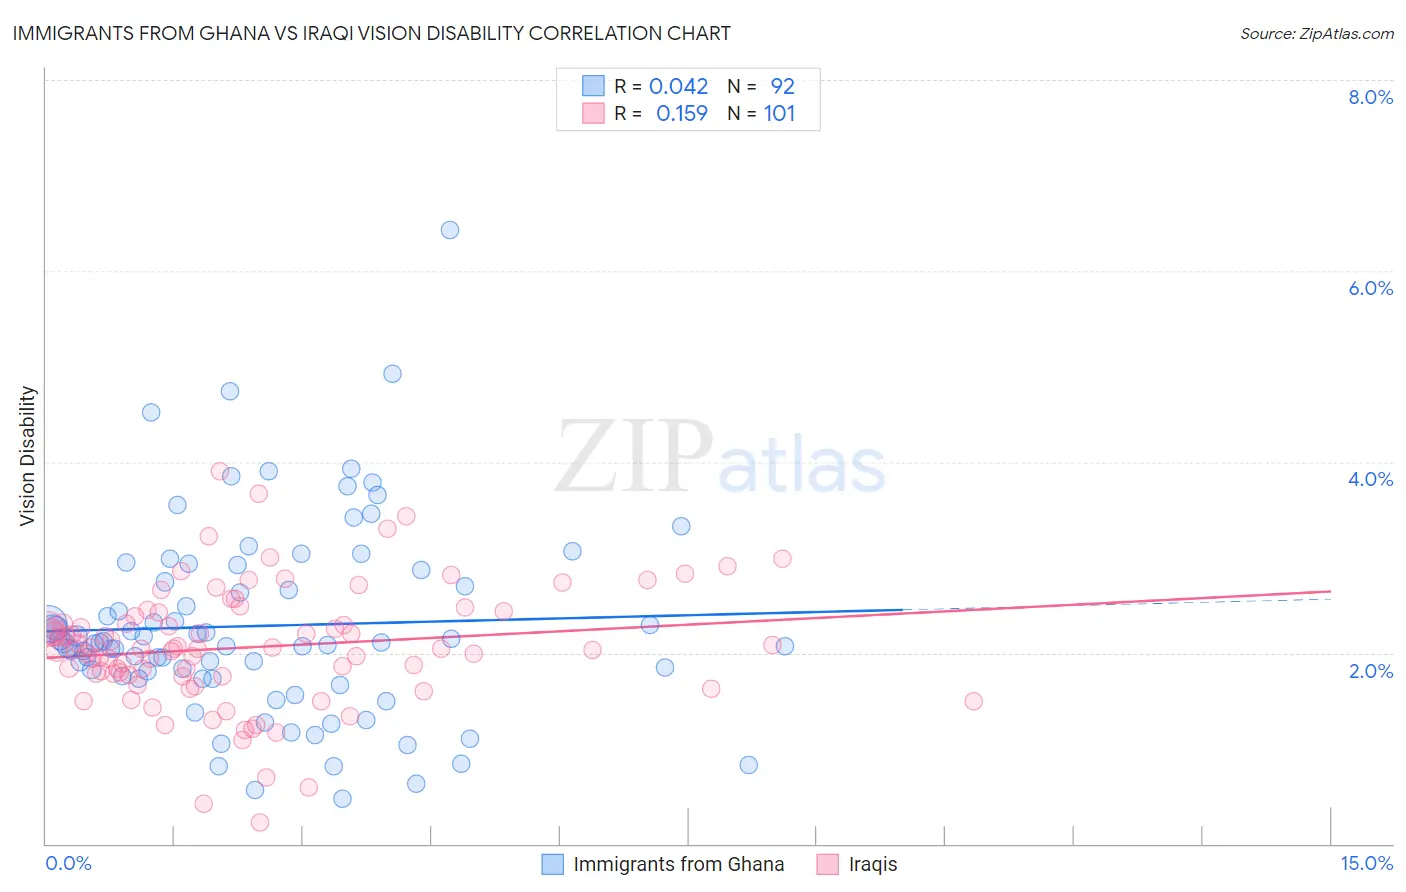
Immigrants from Ghana vs Iraqi Vision Disability Correlation Chart
The statistical analysis conducted on geographies consisting of 199,859,756 people shows no correlation between the proportion of Immigrants from Ghana and percentage of population with vision disability in the United States with a correlation coefficient (R) of 0.042 and weighted average of 2.2%. Similarly, the statistical analysis conducted on geographies consisting of 170,621,066 people shows a poor positive correlation between the proportion of Iraqis and percentage of population with vision disability in the United States with a correlation coefficient (R) of 0.159 and weighted average of 2.1%, a difference of 4.9%.
Vision Disability Correlation Summary
| Measurement | Immigrants from Ghana | Iraqi |
| Minimum | 0.47% | 0.23% |
| Maximum | 6.4% | 3.9% |
| Range | 6.0% | 3.7% |
| Mean | 2.3% | 2.1% |
| Median | 2.1% | 2.0% |
| Interquartile 25% (IQ1) | 1.7% | 1.8% |
| Interquartile 75% (IQ3) | 2.8% | 2.4% |
| Interquartile Range (IQR) | 1.1% | 0.64% |
| Standard Deviation (Sample) | 1.0% | 0.63% |
| Standard Deviation (Population) | 1.0% | 0.63% |
Similar Demographics by Vision Disability
Demographics Similar to Immigrants from Ghana by Vision Disability
In terms of vision disability, the demographic groups most similar to Immigrants from Ghana are Bermudan (2.2%, a difference of 0.010%), Indonesian (2.2%, a difference of 0.10%), Trinidadian and Tobagonian (2.2%, a difference of 0.13%), Nigerian (2.3%, a difference of 0.34%), and Immigrants from Uruguay (2.2%, a difference of 0.44%).
| Demographics | Rating | Rank | Vision Disability |
| Pennsylvania Germans | 14.5 /100 | #206 | Poor 2.2% |
| Immigrants | Nigeria | 13.5 /100 | #207 | Poor 2.2% |
| Germans | 13.4 /100 | #208 | Poor 2.2% |
| Immigrants | Brazil | 13.1 /100 | #209 | Poor 2.2% |
| Immigrants | Uruguay | 11.5 /100 | #210 | Poor 2.2% |
| Indonesians | 9.5 /100 | #211 | Tragic 2.2% |
| Bermudans | 9.0 /100 | #212 | Tragic 2.2% |
| Immigrants | Ghana | 8.9 /100 | #213 | Tragic 2.2% |
| Trinidadians and Tobagonians | 8.2 /100 | #214 | Tragic 2.2% |
| Nigerians | 7.2 /100 | #215 | Tragic 2.3% |
| Immigrants | Trinidad and Tobago | 6.1 /100 | #216 | Tragic 2.3% |
| Barbadians | 5.1 /100 | #217 | Tragic 2.3% |
| Portuguese | 4.9 /100 | #218 | Tragic 2.3% |
| Ecuadorians | 4.6 /100 | #219 | Tragic 2.3% |
| Guamanians/Chamorros | 3.9 /100 | #220 | Tragic 2.3% |
Demographics Similar to Iraqis by Vision Disability
In terms of vision disability, the demographic groups most similar to Iraqis are Hungarian (2.1%, a difference of 0.030%), Austrian (2.1%, a difference of 0.090%), Icelander (2.1%, a difference of 0.12%), South African (2.1%, a difference of 0.15%), and Immigrants from Uzbekistan (2.1%, a difference of 0.16%).
| Demographics | Rating | Rank | Vision Disability |
| Slovenes | 73.6 /100 | #154 | Good 2.1% |
| Immigrants | Colombia | 72.1 /100 | #155 | Good 2.1% |
| Pakistanis | 71.6 /100 | #156 | Good 2.1% |
| Serbians | 70.2 /100 | #157 | Good 2.1% |
| Immigrants | Uzbekistan | 69.9 /100 | #158 | Good 2.1% |
| South Africans | 69.8 /100 | #159 | Good 2.1% |
| Austrians | 69.0 /100 | #160 | Good 2.1% |
| Iraqis | 67.7 /100 | #161 | Good 2.1% |
| Hungarians | 67.4 /100 | #162 | Good 2.1% |
| Icelanders | 66.1 /100 | #163 | Good 2.1% |
| Immigrants | Bangladesh | 65.5 /100 | #164 | Good 2.1% |
| Immigrants | Iraq | 64.8 /100 | #165 | Good 2.1% |
| Immigrants | England | 62.8 /100 | #166 | Good 2.1% |
| Immigrants | Africa | 62.6 /100 | #167 | Good 2.1% |
| Brazilians | 62.2 /100 | #168 | Good 2.1% |