Immigrants from Ghana vs American Seniors Poverty Over the Age of 75
COMPARE
Immigrants from Ghana
American
Seniors Poverty Over the Age of 75
Seniors Poverty Over the Age of 75 Comparison
Immigrants from Ghana
Americans
14.4%
SENIORS POVERTY OVER THE AGE OF 75
0.0/ 100
METRIC RATING
271st/ 347
METRIC RANK
12.0%
SENIORS POVERTY OVER THE AGE OF 75
71.0/ 100
METRIC RATING
143rd/ 347
METRIC RANK
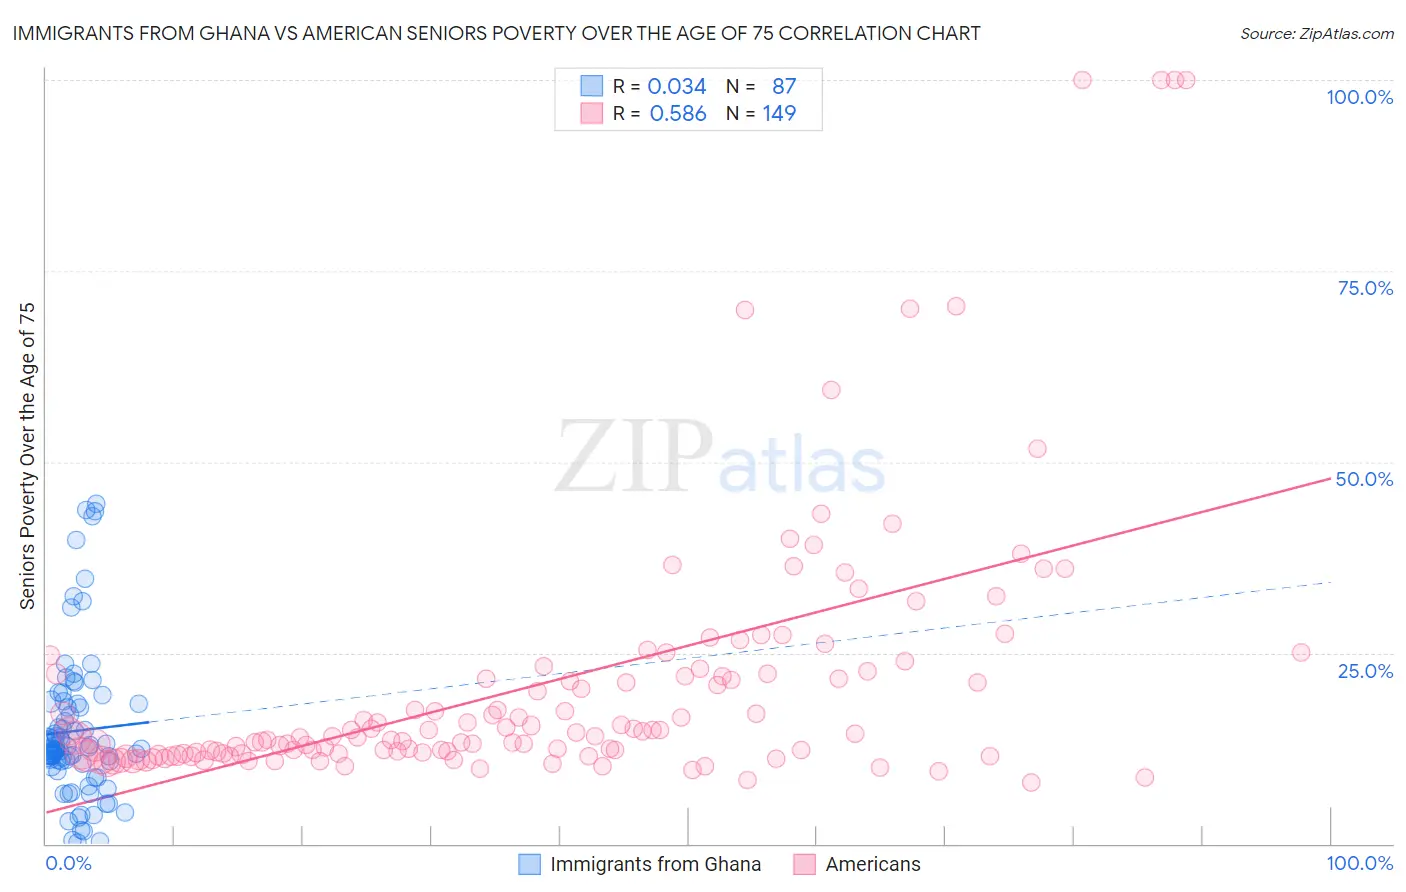
Immigrants from Ghana vs American Seniors Poverty Over the Age of 75 Correlation Chart
The statistical analysis conducted on geographies consisting of 198,360,562 people shows no correlation between the proportion of Immigrants from Ghana and poverty level among seniors over the age of 75 in the United States with a correlation coefficient (R) of 0.034 and weighted average of 14.4%. Similarly, the statistical analysis conducted on geographies consisting of 563,023,390 people shows a substantial positive correlation between the proportion of Americans and poverty level among seniors over the age of 75 in the United States with a correlation coefficient (R) of 0.586 and weighted average of 12.0%, a difference of 20.0%.
Seniors Poverty Over the Age of 75 Correlation Summary
| Measurement | Immigrants from Ghana | American |
| Minimum | 0.23% | 8.0% |
| Maximum | 44.4% | 100.0% |
| Range | 44.2% | 92.0% |
| Mean | 14.8% | 20.9% |
| Median | 12.5% | 14.1% |
| Interquartile 25% (IQ1) | 10.2% | 11.8% |
| Interquartile 75% (IQ3) | 18.3% | 22.3% |
| Interquartile Range (IQR) | 8.2% | 10.5% |
| Standard Deviation (Sample) | 9.8% | 17.6% |
| Standard Deviation (Population) | 9.8% | 17.5% |
Similar Demographics by Seniors Poverty Over the Age of 75
Demographics Similar to Immigrants from Ghana by Seniors Poverty Over the Age of 75
In terms of seniors poverty over the age of 75, the demographic groups most similar to Immigrants from Ghana are Mexican (14.4%, a difference of 0.11%), Immigrants from South America (14.4%, a difference of 0.33%), Immigrants from Uruguay (14.3%, a difference of 0.48%), Immigrants from Bahamas (14.4%, a difference of 0.50%), and Immigrants from Venezuela (14.3%, a difference of 0.62%).
| Demographics | Rating | Rank | Seniors Poverty Over the Age of 75 |
| South Americans | 0.0 /100 | #264 | Tragic 14.1% |
| Salvadorans | 0.0 /100 | #265 | Tragic 14.2% |
| Armenians | 0.0 /100 | #266 | Tragic 14.2% |
| Venezuelans | 0.0 /100 | #267 | Tragic 14.2% |
| Colombians | 0.0 /100 | #268 | Tragic 14.3% |
| Immigrants | Venezuela | 0.0 /100 | #269 | Tragic 14.3% |
| Immigrants | Uruguay | 0.0 /100 | #270 | Tragic 14.3% |
| Immigrants | Ghana | 0.0 /100 | #271 | Tragic 14.4% |
| Mexicans | 0.0 /100 | #272 | Tragic 14.4% |
| Immigrants | South America | 0.0 /100 | #273 | Tragic 14.4% |
| Immigrants | Bahamas | 0.0 /100 | #274 | Tragic 14.4% |
| Immigrants | El Salvador | 0.0 /100 | #275 | Tragic 14.5% |
| Soviet Union | 0.0 /100 | #276 | Tragic 14.5% |
| Senegalese | 0.0 /100 | #277 | Tragic 14.5% |
| Immigrants | Colombia | 0.0 /100 | #278 | Tragic 14.6% |
Demographics Similar to Americans by Seniors Poverty Over the Age of 75
In terms of seniors poverty over the age of 75, the demographic groups most similar to Americans are Hmong (12.0%, a difference of 0.010%), Immigrants from Belgium (12.0%, a difference of 0.010%), Immigrants from Laos (12.0%, a difference of 0.050%), Bangladeshi (12.0%, a difference of 0.060%), and Immigrants from Cameroon (12.0%, a difference of 0.080%).
| Demographics | Rating | Rank | Seniors Poverty Over the Age of 75 |
| Immigrants | Philippines | 75.0 /100 | #136 | Good 11.9% |
| Immigrants | Moldova | 74.1 /100 | #137 | Good 11.9% |
| Immigrants | Romania | 72.6 /100 | #138 | Good 11.9% |
| Immigrants | Kenya | 72.6 /100 | #139 | Good 11.9% |
| Immigrants | Pakistan | 71.9 /100 | #140 | Good 12.0% |
| Immigrants | Cameroon | 71.7 /100 | #141 | Good 12.0% |
| Immigrants | Laos | 71.5 /100 | #142 | Good 12.0% |
| Americans | 71.0 /100 | #143 | Good 12.0% |
| Hmong | 70.8 /100 | #144 | Good 12.0% |
| Immigrants | Belgium | 70.8 /100 | #145 | Good 12.0% |
| Bangladeshis | 70.4 /100 | #146 | Good 12.0% |
| Immigrants | Latvia | 69.1 /100 | #147 | Good 12.0% |
| Immigrants | Zaire | 67.6 /100 | #148 | Good 12.0% |
| Asians | 67.4 /100 | #149 | Good 12.0% |
| Cypriots | 67.3 /100 | #150 | Good 12.0% |