Immigrants from Germany vs Laotian Female Disability
COMPARE
Immigrants from Germany
Laotian
Female Disability
Female Disability Comparison
Immigrants from Germany
Laotians
12.7%
FEMALE DISABILITY
1.3/ 100
METRIC RATING
255th/ 347
METRIC RANK
11.4%
FEMALE DISABILITY
99.9/ 100
METRIC RATING
58th/ 347
METRIC RANK
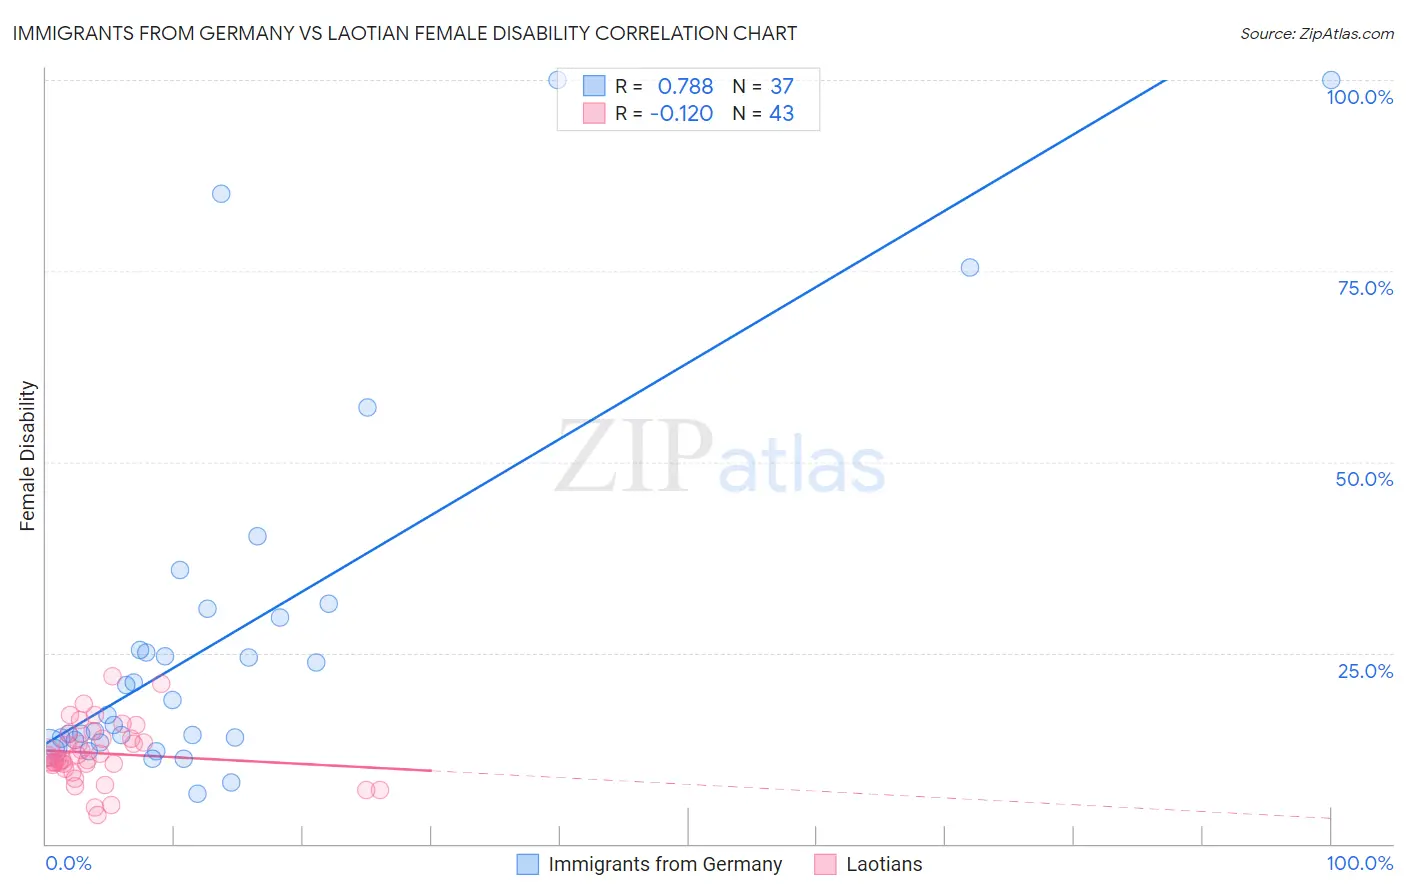
Immigrants from Germany vs Laotian Female Disability Correlation Chart
The statistical analysis conducted on geographies consisting of 463,857,992 people shows a strong positive correlation between the proportion of Immigrants from Germany and percentage of females with a disability in the United States with a correlation coefficient (R) of 0.788 and weighted average of 12.7%. Similarly, the statistical analysis conducted on geographies consisting of 224,852,766 people shows a poor negative correlation between the proportion of Laotians and percentage of females with a disability in the United States with a correlation coefficient (R) of -0.120 and weighted average of 11.4%, a difference of 11.6%.
Female Disability Correlation Summary
| Measurement | Immigrants from Germany | Laotian |
| Minimum | 6.6% | 3.8% |
| Maximum | 100.0% | 21.9% |
| Range | 93.4% | 18.1% |
| Mean | 27.4% | 11.8% |
| Median | 16.9% | 11.2% |
| Interquartile 25% (IQ1) | 13.4% | 10.4% |
| Interquartile 75% (IQ3) | 30.2% | 13.8% |
| Interquartile Range (IQR) | 16.8% | 3.4% |
| Standard Deviation (Sample) | 24.5% | 3.9% |
| Standard Deviation (Population) | 24.2% | 3.8% |
Similar Demographics by Female Disability
Demographics Similar to Immigrants from Germany by Female Disability
In terms of female disability, the demographic groups most similar to Immigrants from Germany are British West Indian (12.7%, a difference of 0.070%), Hawaiian (12.7%, a difference of 0.080%), Liberian (12.7%, a difference of 0.10%), Aleut (12.7%, a difference of 0.10%), and Jamaican (12.7%, a difference of 0.11%).
| Demographics | Rating | Rank | Female Disability |
| Carpatho Rusyns | 2.0 /100 | #248 | Tragic 12.6% |
| Immigrants | Congo | 1.8 /100 | #249 | Tragic 12.7% |
| Slovenes | 1.7 /100 | #250 | Tragic 12.7% |
| Crow | 1.6 /100 | #251 | Tragic 12.7% |
| Immigrants | Caribbean | 1.4 /100 | #252 | Tragic 12.7% |
| Jamaicans | 1.4 /100 | #253 | Tragic 12.7% |
| Hawaiians | 1.4 /100 | #254 | Tragic 12.7% |
| Immigrants | Germany | 1.3 /100 | #255 | Tragic 12.7% |
| British West Indians | 1.2 /100 | #256 | Tragic 12.7% |
| Liberians | 1.1 /100 | #257 | Tragic 12.7% |
| Aleuts | 1.1 /100 | #258 | Tragic 12.7% |
| Immigrants | Armenia | 1.0 /100 | #259 | Tragic 12.7% |
| Sub-Saharan Africans | 1.0 /100 | #260 | Tragic 12.7% |
| Bermudans | 1.0 /100 | #261 | Tragic 12.7% |
| Czechoslovakians | 0.9 /100 | #262 | Tragic 12.7% |
Demographics Similar to Laotians by Female Disability
In terms of female disability, the demographic groups most similar to Laotians are South American (11.4%, a difference of 0.020%), Taiwanese (11.4%, a difference of 0.090%), Immigrants from Spain (11.4%, a difference of 0.13%), Immigrants from Bulgaria (11.4%, a difference of 0.25%), and Immigrants from France (11.4%, a difference of 0.31%).
| Demographics | Rating | Rank | Female Disability |
| Immigrants | Belgium | 100.0 /100 | #51 | Exceptional 11.3% |
| Immigrants | Peru | 99.9 /100 | #52 | Exceptional 11.3% |
| Immigrants | Saudi Arabia | 99.9 /100 | #53 | Exceptional 11.3% |
| Peruvians | 99.9 /100 | #54 | Exceptional 11.3% |
| Bulgarians | 99.9 /100 | #55 | Exceptional 11.3% |
| Taiwanese | 99.9 /100 | #56 | Exceptional 11.4% |
| South Americans | 99.9 /100 | #57 | Exceptional 11.4% |
| Laotians | 99.9 /100 | #58 | Exceptional 11.4% |
| Immigrants | Spain | 99.9 /100 | #59 | Exceptional 11.4% |
| Immigrants | Bulgaria | 99.9 /100 | #60 | Exceptional 11.4% |
| Immigrants | France | 99.9 /100 | #61 | Exceptional 11.4% |
| Sri Lankans | 99.9 /100 | #62 | Exceptional 11.4% |
| Immigrants | Colombia | 99.9 /100 | #63 | Exceptional 11.4% |
| Immigrants | El Salvador | 99.9 /100 | #64 | Exceptional 11.4% |
| Immigrants | South America | 99.9 /100 | #65 | Exceptional 11.4% |