Immigrants from Fiji vs Alaskan Athabascan Disability Age Over 75
COMPARE
Immigrants from Fiji
Alaskan Athabascan
Disability Age Over 75
Disability Age Over 75 Comparison
Immigrants from Fiji
Alaskan Athabascans
50.6%
DISABILITY AGE OVER 75
0.0/ 100
METRIC RATING
307th/ 347
METRIC RANK
54.0%
DISABILITY AGE OVER 75
0.0/ 100
METRIC RATING
334th/ 347
METRIC RANK
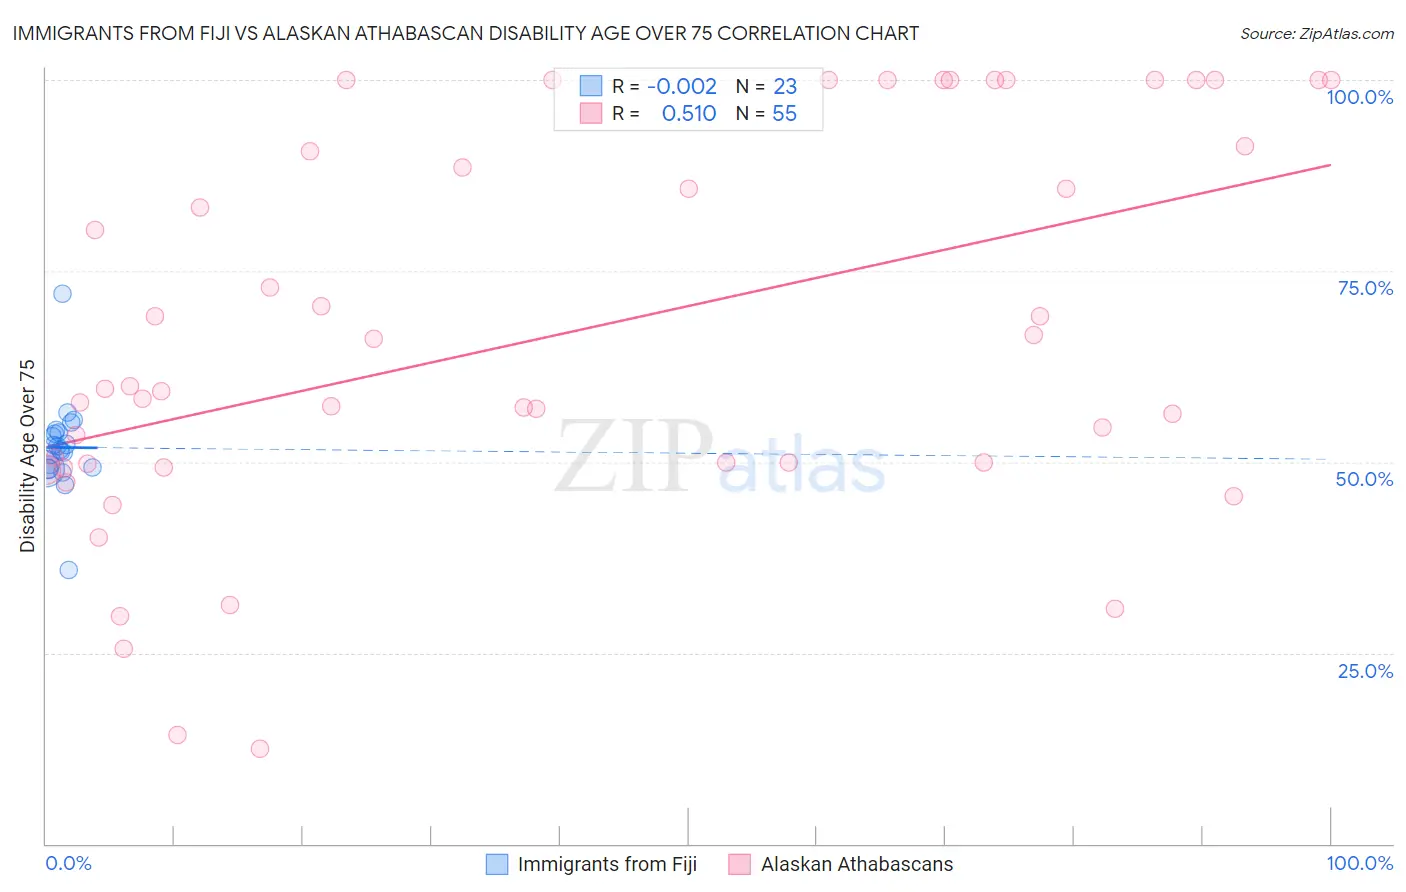
Immigrants from Fiji vs Alaskan Athabascan Disability Age Over 75 Correlation Chart
The statistical analysis conducted on geographies consisting of 93,724,522 people shows no correlation between the proportion of Immigrants from Fiji and percentage of population with a disability over the age of 75 in the United States with a correlation coefficient (R) of -0.002 and weighted average of 50.6%. Similarly, the statistical analysis conducted on geographies consisting of 45,799,271 people shows a substantial positive correlation between the proportion of Alaskan Athabascans and percentage of population with a disability over the age of 75 in the United States with a correlation coefficient (R) of 0.510 and weighted average of 54.0%, a difference of 6.7%.
Disability Age Over 75 Correlation Summary
| Measurement | Immigrants from Fiji | Alaskan Athabascan |
| Minimum | 35.9% | 12.5% |
| Maximum | 72.0% | 100.0% |
| Range | 36.1% | 87.5% |
| Mean | 51.9% | 66.7% |
| Median | 51.5% | 59.6% |
| Interquartile 25% (IQ1) | 49.1% | 49.8% |
| Interquartile 75% (IQ3) | 53.8% | 91.3% |
| Interquartile Range (IQR) | 4.7% | 41.5% |
| Standard Deviation (Sample) | 6.0% | 25.1% |
| Standard Deviation (Population) | 5.9% | 24.8% |
Similar Demographics by Disability Age Over 75
Demographics Similar to Immigrants from Fiji by Disability Age Over 75
In terms of disability age over 75, the demographic groups most similar to Immigrants from Fiji are Hispanic or Latino (50.6%, a difference of 0.020%), Aleut (50.6%, a difference of 0.030%), Immigrants from Central America (50.5%, a difference of 0.060%), Tlingit-Haida (50.6%, a difference of 0.070%), and Central American Indian (50.5%, a difference of 0.15%).
| Demographics | Rating | Rank | Disability Age Over 75 |
| Cape Verdeans | 0.0 /100 | #300 | Tragic 50.1% |
| Dominicans | 0.0 /100 | #301 | Tragic 50.2% |
| Cherokee | 0.0 /100 | #302 | Tragic 50.2% |
| Japanese | 0.0 /100 | #303 | Tragic 50.2% |
| Immigrants | Dominican Republic | 0.0 /100 | #304 | Tragic 50.3% |
| Central American Indians | 0.0 /100 | #305 | Tragic 50.5% |
| Immigrants | Central America | 0.0 /100 | #306 | Tragic 50.5% |
| Immigrants | Fiji | 0.0 /100 | #307 | Tragic 50.6% |
| Hispanics or Latinos | 0.0 /100 | #308 | Tragic 50.6% |
| Aleuts | 0.0 /100 | #309 | Tragic 50.6% |
| Tlingit-Haida | 0.0 /100 | #310 | Tragic 50.6% |
| Cajuns | 0.0 /100 | #311 | Tragic 50.7% |
| Cheyenne | 0.0 /100 | #312 | Tragic 50.9% |
| Immigrants | Azores | 0.0 /100 | #313 | Tragic 50.9% |
| Immigrants | Mexico | 0.0 /100 | #314 | Tragic 51.1% |
Demographics Similar to Alaskan Athabascans by Disability Age Over 75
In terms of disability age over 75, the demographic groups most similar to Alaskan Athabascans are Kiowa (54.2%, a difference of 0.53%), Apache (53.6%, a difference of 0.67%), Immigrants from Armenia (54.3%, a difference of 0.69%), Yuman (54.4%, a difference of 0.85%), and Native/Alaskan (53.1%, a difference of 1.7%).
| Demographics | Rating | Rank | Disability Age Over 75 |
| Nepalese | 0.0 /100 | #327 | Tragic 52.6% |
| Choctaw | 0.0 /100 | #328 | Tragic 52.7% |
| Alaska Natives | 0.0 /100 | #329 | Tragic 52.8% |
| Puerto Ricans | 0.0 /100 | #330 | Tragic 52.9% |
| Hopi | 0.0 /100 | #331 | Tragic 52.9% |
| Natives/Alaskans | 0.0 /100 | #332 | Tragic 53.1% |
| Apache | 0.0 /100 | #333 | Tragic 53.6% |
| Alaskan Athabascans | 0.0 /100 | #334 | Tragic 54.0% |
| Kiowa | 0.0 /100 | #335 | Tragic 54.2% |
| Immigrants | Armenia | 0.0 /100 | #336 | Tragic 54.3% |
| Yuman | 0.0 /100 | #337 | Tragic 54.4% |
| Colville | 0.0 /100 | #338 | Tragic 55.4% |
| Pima | 0.0 /100 | #339 | Tragic 55.8% |
| Pueblo | 0.0 /100 | #340 | Tragic 55.9% |
| Houma | 0.0 /100 | #341 | Tragic 56.2% |