Immigrants from Fiji vs Ottawa Disability Age 65 to 74
COMPARE
Immigrants from Fiji
Ottawa
Disability Age 65 to 74
Disability Age 65 to 74 Comparison
Immigrants from Fiji
Ottawa
25.0%
DISABILITY AGE 65 TO 74
0.8/ 100
METRIC RATING
249th/ 347
METRIC RANK
25.6%
DISABILITY AGE 65 TO 74
0.1/ 100
METRIC RATING
267th/ 347
METRIC RANK
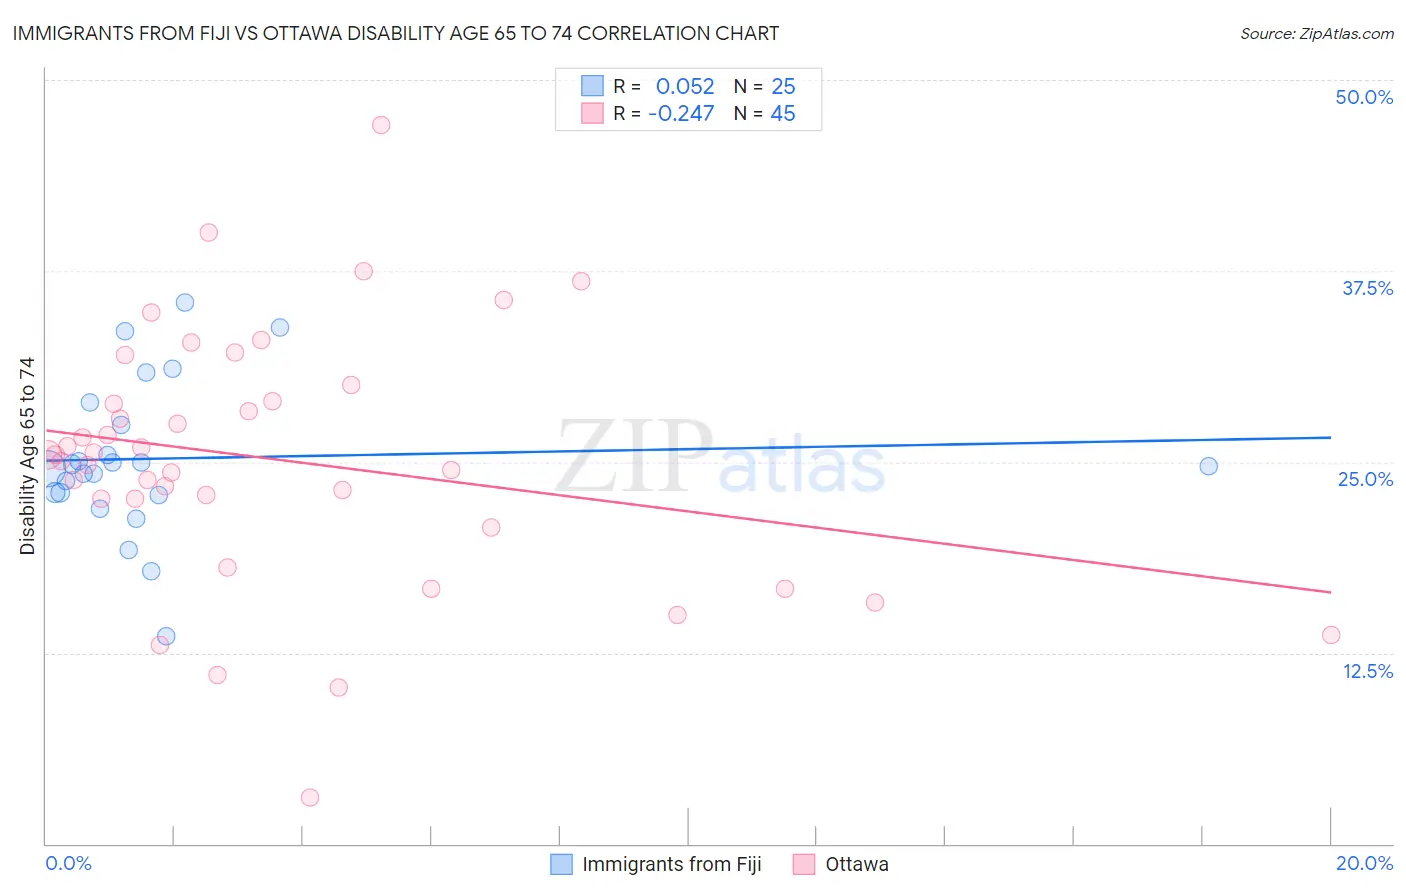
Immigrants from Fiji vs Ottawa Disability Age 65 to 74 Correlation Chart
The statistical analysis conducted on geographies consisting of 93,725,499 people shows a slight positive correlation between the proportion of Immigrants from Fiji and percentage of population with a disability between the ages 65 and 75 in the United States with a correlation coefficient (R) of 0.052 and weighted average of 25.0%. Similarly, the statistical analysis conducted on geographies consisting of 49,922,669 people shows a weak negative correlation between the proportion of Ottawa and percentage of population with a disability between the ages 65 and 75 in the United States with a correlation coefficient (R) of -0.247 and weighted average of 25.6%, a difference of 2.6%.
Disability Age 65 to 74 Correlation Summary
| Measurement | Immigrants from Fiji | Ottawa |
| Minimum | 13.6% | 3.0% |
| Maximum | 35.4% | 47.1% |
| Range | 21.9% | 44.0% |
| Mean | 25.2% | 25.1% |
| Median | 24.7% | 25.5% |
| Interquartile 25% (IQ1) | 22.9% | 21.6% |
| Interquartile 75% (IQ3) | 28.2% | 29.5% |
| Interquartile Range (IQR) | 5.3% | 7.9% |
| Standard Deviation (Sample) | 5.0% | 8.4% |
| Standard Deviation (Population) | 4.9% | 8.3% |
Demographics Similar to Immigrants from Fiji and Ottawa by Disability Age 65 to 74
In terms of disability age 65 to 74, the demographic groups most similar to Immigrants from Fiji are Salvadoran (25.0%, a difference of 0.020%), Senegalese (24.9%, a difference of 0.10%), Nonimmigrants (25.0%, a difference of 0.22%), Immigrants from El Salvador (25.1%, a difference of 0.41%), and Subsaharan African (25.1%, a difference of 0.44%). Similarly, the demographic groups most similar to Ottawa are Liberian (25.6%, a difference of 0.10%), Immigrants from Latin America (25.6%, a difference of 0.14%), Guatemalan (25.5%, a difference of 0.23%), Hawaiian (25.5%, a difference of 0.27%), and Samoan (25.4%, a difference of 0.62%).
| Demographics | Rating | Rank | Disability Age 65 to 74 |
| Senegalese | 0.9 /100 | #248 | Tragic 24.9% |
| Immigrants | Fiji | 0.8 /100 | #249 | Tragic 25.0% |
| Salvadorans | 0.8 /100 | #250 | Tragic 25.0% |
| Immigrants | Nonimmigrants | 0.7 /100 | #251 | Tragic 25.0% |
| Immigrants | El Salvador | 0.6 /100 | #252 | Tragic 25.1% |
| Sub-Saharan Africans | 0.6 /100 | #253 | Tragic 25.1% |
| Somalis | 0.6 /100 | #254 | Tragic 25.1% |
| Central Americans | 0.5 /100 | #255 | Tragic 25.1% |
| Immigrants | Somalia | 0.4 /100 | #256 | Tragic 25.2% |
| Guamanians/Chamorros | 0.3 /100 | #257 | Tragic 25.3% |
| Marshallese | 0.3 /100 | #258 | Tragic 25.3% |
| Immigrants | Cambodia | 0.3 /100 | #259 | Tragic 25.3% |
| Malaysians | 0.2 /100 | #260 | Tragic 25.4% |
| Cape Verdeans | 0.2 /100 | #261 | Tragic 25.4% |
| Samoans | 0.2 /100 | #262 | Tragic 25.4% |
| Iroquois | 0.2 /100 | #263 | Tragic 25.4% |
| Hawaiians | 0.2 /100 | #264 | Tragic 25.5% |
| Guatemalans | 0.2 /100 | #265 | Tragic 25.5% |
| Immigrants | Latin America | 0.1 /100 | #266 | Tragic 25.6% |
| Ottawa | 0.1 /100 | #267 | Tragic 25.6% |
| Liberians | 0.1 /100 | #268 | Tragic 25.6% |