Immigrants from Europe vs Czech Female Disability
COMPARE
Immigrants from Europe
Czech
Female Disability
Female Disability Comparison
Immigrants from Europe
Czechs
11.8%
FEMALE DISABILITY
96.2/ 100
METRIC RATING
126th/ 347
METRIC RANK
12.1%
FEMALE DISABILITY
63.6/ 100
METRIC RATING
164th/ 347
METRIC RANK
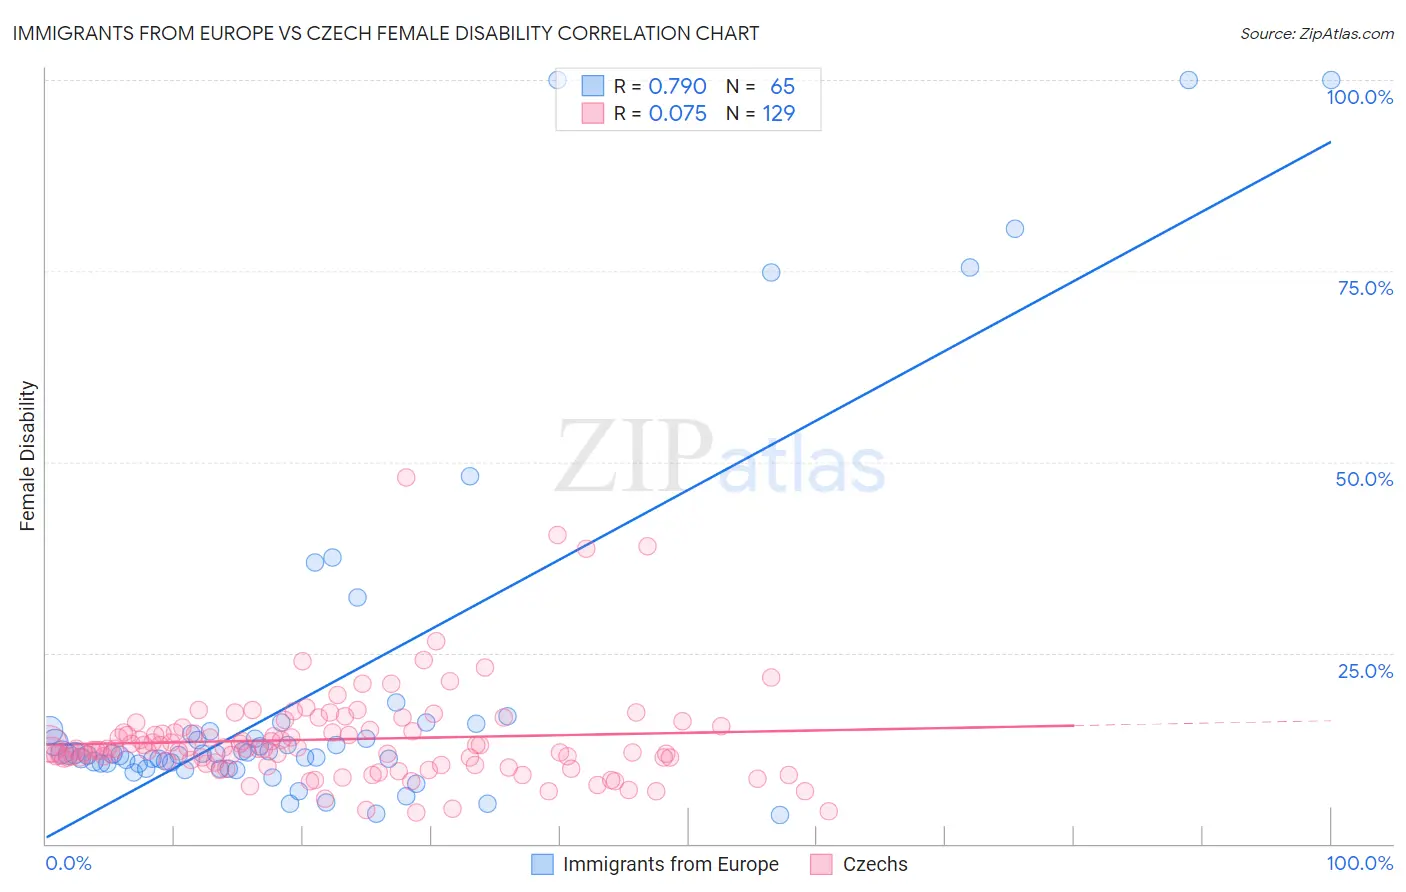
Immigrants from Europe vs Czech Female Disability Correlation Chart
The statistical analysis conducted on geographies consisting of 547,243,236 people shows a strong positive correlation between the proportion of Immigrants from Europe and percentage of females with a disability in the United States with a correlation coefficient (R) of 0.790 and weighted average of 11.8%. Similarly, the statistical analysis conducted on geographies consisting of 484,697,758 people shows a slight positive correlation between the proportion of Czechs and percentage of females with a disability in the United States with a correlation coefficient (R) of 0.075 and weighted average of 12.1%, a difference of 2.6%.
Female Disability Correlation Summary
| Measurement | Immigrants from Europe | Czech |
| Minimum | 3.8% | 4.1% |
| Maximum | 100.0% | 48.0% |
| Range | 96.2% | 43.9% |
| Mean | 20.0% | 13.7% |
| Median | 11.8% | 12.5% |
| Interquartile 25% (IQ1) | 10.5% | 10.6% |
| Interquartile 75% (IQ3) | 14.8% | 14.8% |
| Interquartile Range (IQR) | 4.3% | 4.3% |
| Standard Deviation (Sample) | 23.5% | 6.4% |
| Standard Deviation (Population) | 23.3% | 6.4% |
Similar Demographics by Female Disability
Demographics Similar to Immigrants from Europe by Female Disability
In terms of female disability, the demographic groups most similar to Immigrants from Europe are Immigrants from Italy (11.8%, a difference of 0.060%), Russian (11.8%, a difference of 0.090%), South American Indian (11.8%, a difference of 0.10%), Immigrants from Croatia (11.8%, a difference of 0.14%), and Immigrants from Latvia (11.8%, a difference of 0.14%).
| Demographics | Rating | Rank | Female Disability |
| Immigrants | Uganda | 97.2 /100 | #119 | Exceptional 11.8% |
| Immigrants | Kazakhstan | 97.0 /100 | #120 | Exceptional 11.8% |
| Immigrants | Netherlands | 96.9 /100 | #121 | Exceptional 11.8% |
| Immigrants | North Macedonia | 96.8 /100 | #122 | Exceptional 11.8% |
| Immigrants | Croatia | 96.7 /100 | #123 | Exceptional 11.8% |
| Russians | 96.5 /100 | #124 | Exceptional 11.8% |
| Immigrants | Italy | 96.4 /100 | #125 | Exceptional 11.8% |
| Immigrants | Europe | 96.2 /100 | #126 | Exceptional 11.8% |
| South American Indians | 95.8 /100 | #127 | Exceptional 11.8% |
| Immigrants | Latvia | 95.6 /100 | #128 | Exceptional 11.8% |
| Macedonians | 95.5 /100 | #129 | Exceptional 11.8% |
| Nicaraguans | 95.2 /100 | #130 | Exceptional 11.9% |
| Arabs | 95.1 /100 | #131 | Exceptional 11.9% |
| Immigrants | Syria | 94.6 /100 | #132 | Exceptional 11.9% |
| Kenyans | 94.5 /100 | #133 | Exceptional 11.9% |
Demographics Similar to Czechs by Female Disability
In terms of female disability, the demographic groups most similar to Czechs are Guatemalan (12.1%, a difference of 0.010%), Immigrants from Ukraine (12.1%, a difference of 0.030%), Guyanese (12.1%, a difference of 0.040%), Immigrants from Oceania (12.1%, a difference of 0.070%), and Immigrants from Guatemala (12.1%, a difference of 0.10%).
| Demographics | Rating | Rank | Female Disability |
| Danes | 72.5 /100 | #157 | Good 12.1% |
| Immigrants | Middle Africa | 72.4 /100 | #158 | Good 12.1% |
| Immigrants | Central America | 67.7 /100 | #159 | Good 12.1% |
| Immigrants | Guatemala | 66.0 /100 | #160 | Good 12.1% |
| Guyanese | 64.7 /100 | #161 | Good 12.1% |
| Immigrants | Ukraine | 64.3 /100 | #162 | Good 12.1% |
| Guatemalans | 63.8 /100 | #163 | Good 12.1% |
| Czechs | 63.6 /100 | #164 | Good 12.1% |
| Immigrants | Oceania | 61.8 /100 | #165 | Good 12.1% |
| Lithuanians | 59.5 /100 | #166 | Average 12.2% |
| Immigrants | Latin America | 59.0 /100 | #167 | Average 12.2% |
| Immigrants | Haiti | 58.8 /100 | #168 | Average 12.2% |
| Lebanese | 58.1 /100 | #169 | Average 12.2% |
| Maltese | 57.0 /100 | #170 | Average 12.2% |
| Immigrants | Southern Europe | 56.3 /100 | #171 | Average 12.2% |