Immigrants from Eritrea vs Alsatian Ambulatory Disability
COMPARE
Immigrants from Eritrea
Alsatian
Ambulatory Disability
Ambulatory Disability Comparison
Immigrants from Eritrea
Alsatians
5.5%
AMBULATORY DISABILITY
100.0/ 100
METRIC RATING
39th/ 347
METRIC RANK
6.3%
AMBULATORY DISABILITY
15.1/ 100
METRIC RATING
207th/ 347
METRIC RANK
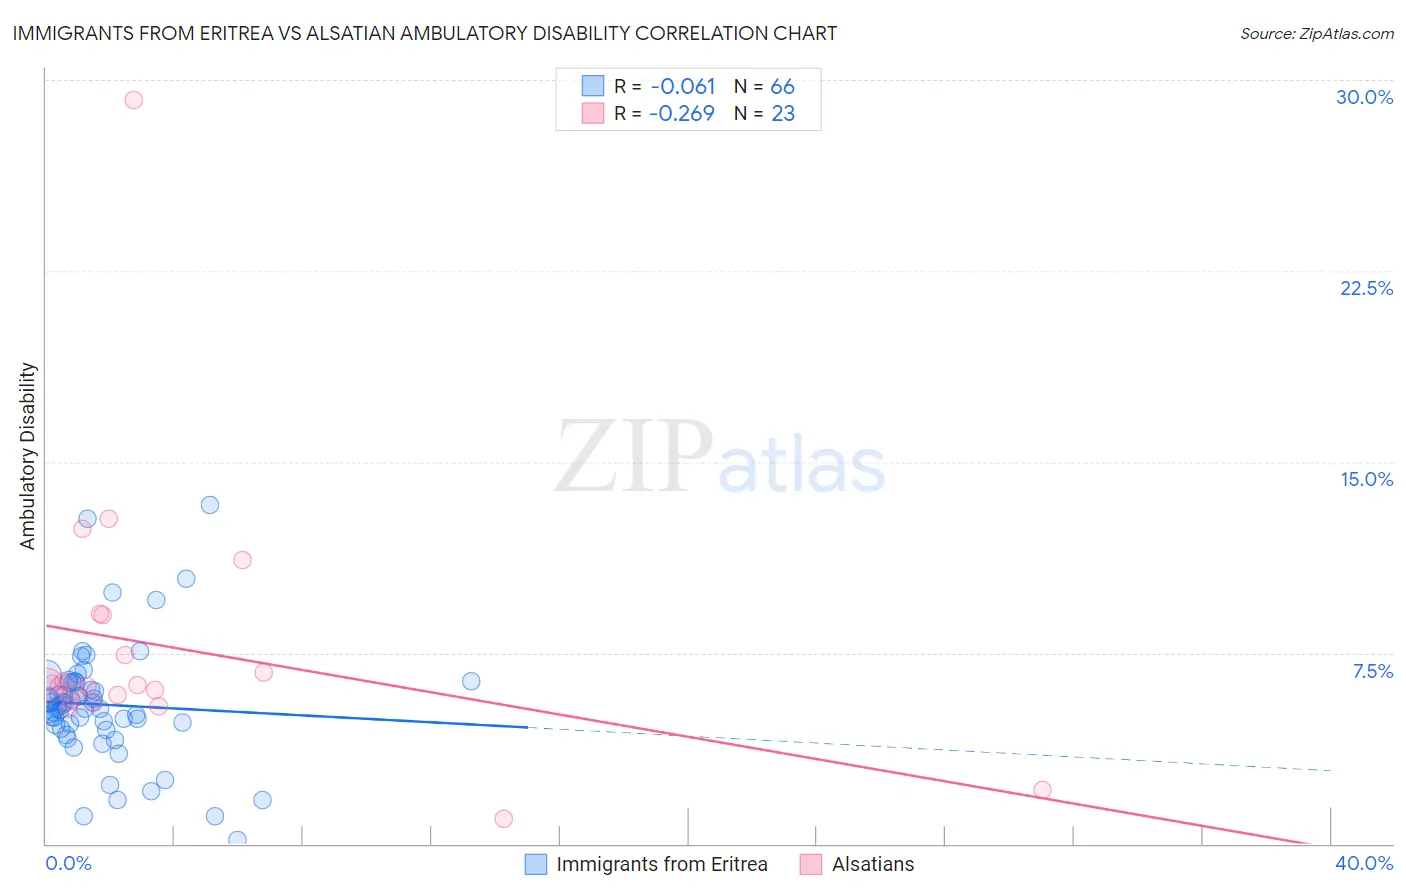
Immigrants from Eritrea vs Alsatian Ambulatory Disability Correlation Chart
The statistical analysis conducted on geographies consisting of 104,852,788 people shows a slight negative correlation between the proportion of Immigrants from Eritrea and percentage of population with ambulatory disability in the United States with a correlation coefficient (R) of -0.061 and weighted average of 5.5%. Similarly, the statistical analysis conducted on geographies consisting of 82,679,981 people shows a weak negative correlation between the proportion of Alsatians and percentage of population with ambulatory disability in the United States with a correlation coefficient (R) of -0.269 and weighted average of 6.3%, a difference of 14.1%.
Ambulatory Disability Correlation Summary
| Measurement | Immigrants from Eritrea | Alsatian |
| Minimum | 0.17% | 0.97% |
| Maximum | 13.3% | 29.2% |
| Range | 13.1% | 28.2% |
| Mean | 5.5% | 7.7% |
| Median | 5.4% | 6.2% |
| Interquartile 25% (IQ1) | 4.7% | 5.6% |
| Interquartile 75% (IQ3) | 6.3% | 9.0% |
| Interquartile Range (IQR) | 1.6% | 3.4% |
| Standard Deviation (Sample) | 2.3% | 5.4% |
| Standard Deviation (Population) | 2.3% | 5.3% |
Similar Demographics by Ambulatory Disability
Demographics Similar to Immigrants from Eritrea by Ambulatory Disability
In terms of ambulatory disability, the demographic groups most similar to Immigrants from Eritrea are Turkish (5.5%, a difference of 0.090%), Cypriot (5.5%, a difference of 0.090%), Immigrants from Malaysia (5.5%, a difference of 0.11%), Afghan (5.5%, a difference of 0.18%), and Immigrants from Asia (5.5%, a difference of 0.22%).
| Demographics | Rating | Rank | Ambulatory Disability |
| Immigrants | Australia | 100.0 /100 | #32 | Exceptional 5.5% |
| Immigrants | Pakistan | 100.0 /100 | #33 | Exceptional 5.5% |
| Immigrants | Asia | 100.0 /100 | #34 | Exceptional 5.5% |
| Afghans | 100.0 /100 | #35 | Exceptional 5.5% |
| Immigrants | Malaysia | 100.0 /100 | #36 | Exceptional 5.5% |
| Turks | 100.0 /100 | #37 | Exceptional 5.5% |
| Cypriots | 100.0 /100 | #38 | Exceptional 5.5% |
| Immigrants | Eritrea | 100.0 /100 | #39 | Exceptional 5.5% |
| Venezuelans | 99.9 /100 | #40 | Exceptional 5.5% |
| Mongolians | 99.9 /100 | #41 | Exceptional 5.5% |
| Argentineans | 99.9 /100 | #42 | Exceptional 5.5% |
| Paraguayans | 99.9 /100 | #43 | Exceptional 5.5% |
| Immigrants | Indonesia | 99.9 /100 | #44 | Exceptional 5.5% |
| Immigrants | Sweden | 99.9 /100 | #45 | Exceptional 5.6% |
| Egyptians | 99.9 /100 | #46 | Exceptional 5.6% |
Demographics Similar to Alsatians by Ambulatory Disability
In terms of ambulatory disability, the demographic groups most similar to Alsatians are Bangladeshi (6.3%, a difference of 0.090%), Immigrants from Iraq (6.3%, a difference of 0.11%), Immigrants from Laos (6.3%, a difference of 0.19%), Finnish (6.2%, a difference of 0.21%), and Slovene (6.2%, a difference of 0.28%).
| Demographics | Rating | Rank | Ambulatory Disability |
| Immigrants | Cambodia | 21.5 /100 | #200 | Fair 6.2% |
| Immigrants | Central America | 20.1 /100 | #201 | Fair 6.2% |
| Albanians | 19.7 /100 | #202 | Poor 6.2% |
| Immigrants | Ukraine | 18.4 /100 | #203 | Poor 6.2% |
| Immigrants | Congo | 18.2 /100 | #204 | Poor 6.2% |
| Slovenes | 18.0 /100 | #205 | Poor 6.2% |
| Finns | 17.2 /100 | #206 | Poor 6.2% |
| Alsatians | 15.1 /100 | #207 | Poor 6.3% |
| Bangladeshis | 14.2 /100 | #208 | Poor 6.3% |
| Immigrants | Iraq | 14.0 /100 | #209 | Poor 6.3% |
| Immigrants | Laos | 13.2 /100 | #210 | Poor 6.3% |
| Samoans | 12.1 /100 | #211 | Poor 6.3% |
| Mexican American Indians | 12.0 /100 | #212 | Poor 6.3% |
| Japanese | 12.0 /100 | #213 | Poor 6.3% |
| Immigrants | Mexico | 11.0 /100 | #214 | Poor 6.3% |