Immigrants from Zimbabwe vs Czechoslovakian Hearing Disability
COMPARE
Immigrants from Zimbabwe
Czechoslovakian
Hearing Disability
Hearing Disability Comparison
Immigrants from Zimbabwe
Czechoslovakians
3.0%
HEARING DISABILITY
64.2/ 100
METRIC RATING
165th/ 347
METRIC RANK
3.6%
HEARING DISABILITY
0.0/ 100
METRIC RATING
275th/ 347
METRIC RANK
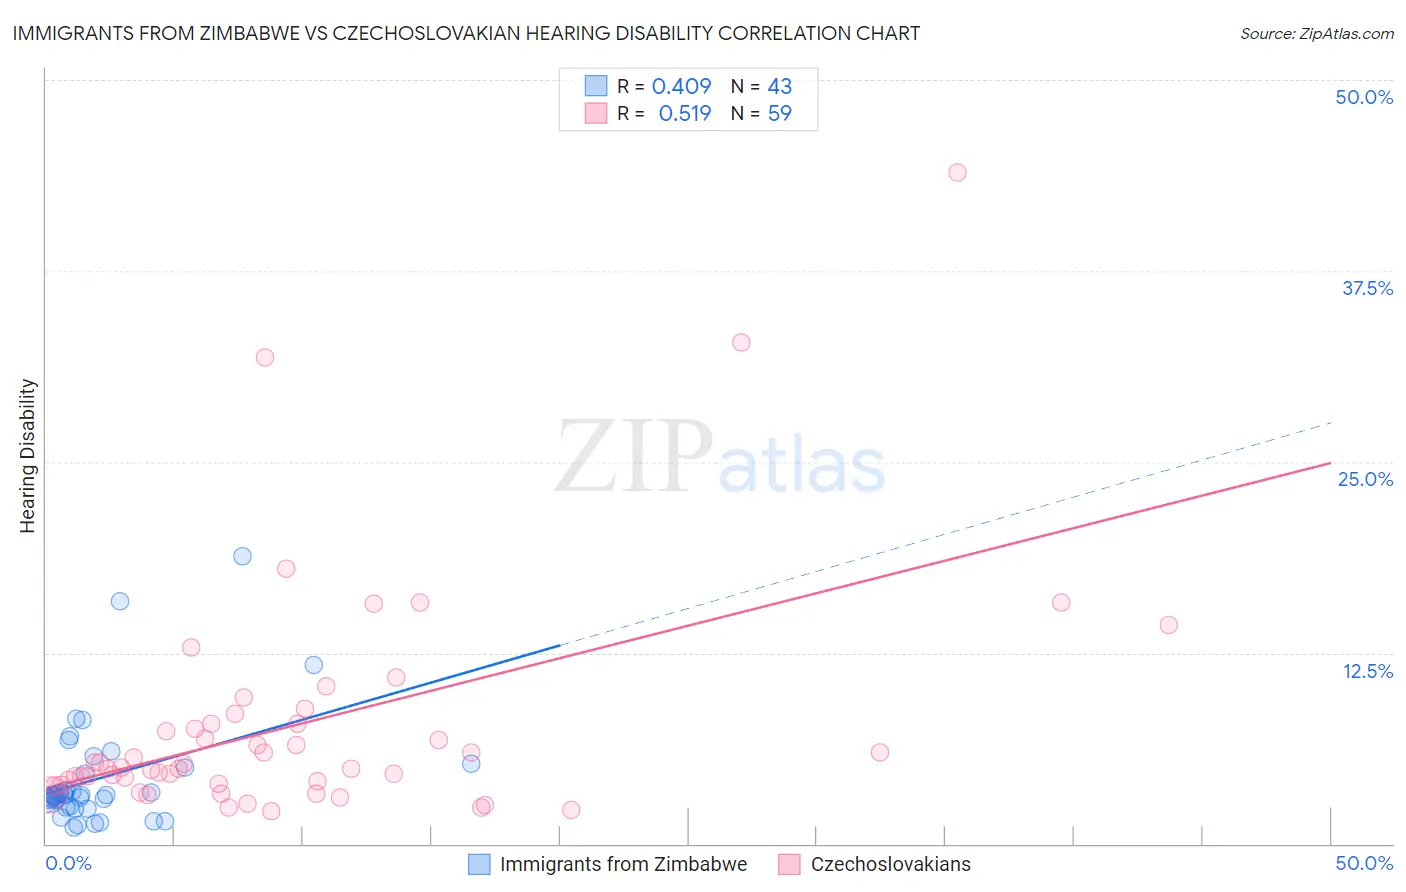
Immigrants from Zimbabwe vs Czechoslovakian Hearing Disability Correlation Chart
The statistical analysis conducted on geographies consisting of 117,807,709 people shows a moderate positive correlation between the proportion of Immigrants from Zimbabwe and percentage of population with hearing disability in the United States with a correlation coefficient (R) of 0.409 and weighted average of 3.0%. Similarly, the statistical analysis conducted on geographies consisting of 368,630,521 people shows a substantial positive correlation between the proportion of Czechoslovakians and percentage of population with hearing disability in the United States with a correlation coefficient (R) of 0.519 and weighted average of 3.6%, a difference of 20.2%.
Hearing Disability Correlation Summary
| Measurement | Immigrants from Zimbabwe | Czechoslovakian |
| Minimum | 1.1% | 2.1% |
| Maximum | 18.9% | 44.0% |
| Range | 17.8% | 41.8% |
| Mean | 4.3% | 7.8% |
| Median | 3.2% | 5.0% |
| Interquartile 25% (IQ1) | 2.5% | 3.9% |
| Interquartile 75% (IQ3) | 5.0% | 7.9% |
| Interquartile Range (IQR) | 2.5% | 4.0% |
| Standard Deviation (Sample) | 3.6% | 7.7% |
| Standard Deviation (Population) | 3.6% | 7.6% |
Similar Demographics by Hearing Disability
Demographics Similar to Immigrants from Zimbabwe by Hearing Disability
In terms of hearing disability, the demographic groups most similar to Immigrants from Zimbabwe are Immigrants from Cambodia (3.0%, a difference of 0.060%), Immigrants from Central America (3.0%, a difference of 0.080%), Immigrants from South Eastern Asia (3.0%, a difference of 0.14%), Immigrants from Japan (2.9%, a difference of 0.22%), and Albanian (2.9%, a difference of 0.25%).
| Demographics | Rating | Rank | Hearing Disability |
| Immigrants | Burma/Myanmar | 69.5 /100 | #158 | Good 2.9% |
| Immigrants | Australia | 67.4 /100 | #159 | Good 2.9% |
| Immigrants | Fiji | 67.1 /100 | #160 | Good 2.9% |
| Albanians | 66.6 /100 | #161 | Good 2.9% |
| Immigrants | Japan | 66.3 /100 | #162 | Good 2.9% |
| Immigrants | Central America | 64.9 /100 | #163 | Good 3.0% |
| Immigrants | Cambodia | 64.8 /100 | #164 | Good 3.0% |
| Immigrants | Zimbabwe | 64.2 /100 | #165 | Good 3.0% |
| Immigrants | South Eastern Asia | 62.9 /100 | #166 | Good 3.0% |
| Immigrants | Eastern Europe | 58.1 /100 | #167 | Average 3.0% |
| Immigrants | Greece | 57.9 /100 | #168 | Average 3.0% |
| Arabs | 57.6 /100 | #169 | Average 3.0% |
| Immigrants | Cabo Verde | 56.9 /100 | #170 | Average 3.0% |
| Immigrants | Ukraine | 56.6 /100 | #171 | Average 3.0% |
| Armenians | 56.0 /100 | #172 | Average 3.0% |
Demographics Similar to Czechoslovakians by Hearing Disability
In terms of hearing disability, the demographic groups most similar to Czechoslovakians are Danish (3.6%, a difference of 0.12%), Swiss (3.5%, a difference of 0.20%), Puerto Rican (3.5%, a difference of 0.53%), Fijian (3.5%, a difference of 0.60%), and Nonimmigrants (3.6%, a difference of 0.82%).
| Demographics | Rating | Rank | Hearing Disability |
| Spaniards | 0.1 /100 | #268 | Tragic 3.5% |
| Ute | 0.1 /100 | #269 | Tragic 3.5% |
| Europeans | 0.1 /100 | #270 | Tragic 3.5% |
| Czechs | 0.1 /100 | #271 | Tragic 3.5% |
| Fijians | 0.0 /100 | #272 | Tragic 3.5% |
| Puerto Ricans | 0.0 /100 | #273 | Tragic 3.5% |
| Swiss | 0.0 /100 | #274 | Tragic 3.5% |
| Czechoslovakians | 0.0 /100 | #275 | Tragic 3.6% |
| Danes | 0.0 /100 | #276 | Tragic 3.6% |
| Immigrants | Nonimmigrants | 0.0 /100 | #277 | Tragic 3.6% |
| Basques | 0.0 /100 | #278 | Tragic 3.6% |
| Slovaks | 0.0 /100 | #279 | Tragic 3.6% |
| French American Indians | 0.0 /100 | #280 | Tragic 3.6% |
| Scandinavians | 0.0 /100 | #281 | Tragic 3.6% |
| Swedes | 0.0 /100 | #282 | Tragic 3.6% |