Immigrants from England vs Argentinean Disability
COMPARE
Immigrants from England
Argentinean
Disability
Disability Comparison
Immigrants from England
Argentineans
12.0%
DISABILITY
12.0/ 100
METRIC RATING
202nd/ 347
METRIC RANK
10.6%
DISABILITY
100.0/ 100
METRIC RATING
26th/ 347
METRIC RANK
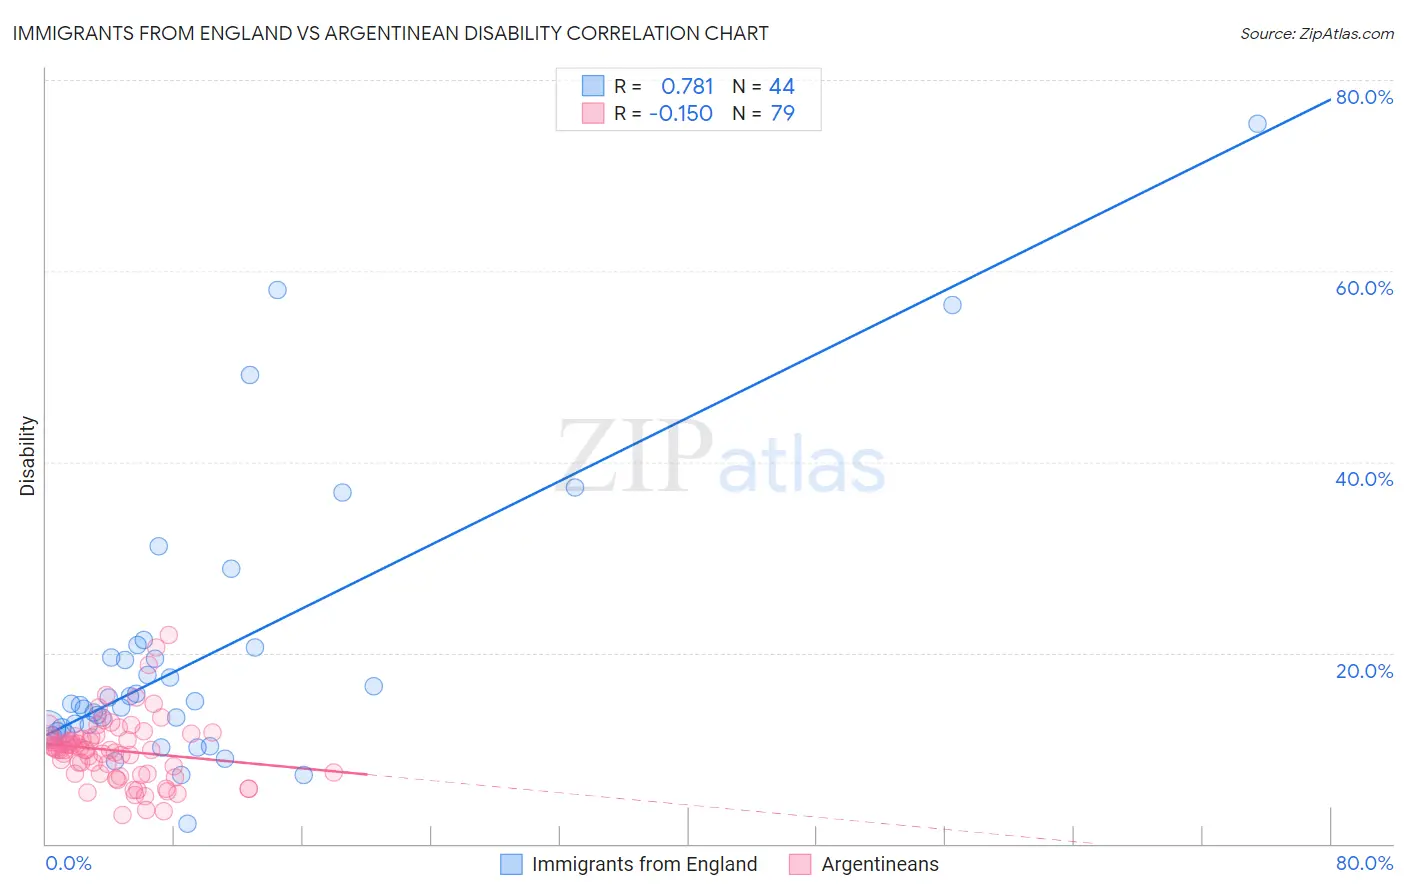
Immigrants from England vs Argentinean Disability Correlation Chart
The statistical analysis conducted on geographies consisting of 391,892,712 people shows a strong positive correlation between the proportion of Immigrants from England and percentage of population with a disability in the United States with a correlation coefficient (R) of 0.781 and weighted average of 12.0%. Similarly, the statistical analysis conducted on geographies consisting of 297,145,092 people shows a poor negative correlation between the proportion of Argentineans and percentage of population with a disability in the United States with a correlation coefficient (R) of -0.150 and weighted average of 10.6%, a difference of 13.0%.
Disability Correlation Summary
| Measurement | Immigrants from England | Argentinean |
| Minimum | 2.1% | 3.1% |
| Maximum | 75.4% | 21.9% |
| Range | 73.3% | 18.8% |
| Mean | 19.7% | 9.8% |
| Median | 14.6% | 9.9% |
| Interquartile 25% (IQ1) | 11.9% | 7.3% |
| Interquartile 75% (IQ3) | 20.1% | 11.2% |
| Interquartile Range (IQR) | 8.1% | 3.9% |
| Standard Deviation (Sample) | 14.9% | 3.4% |
| Standard Deviation (Population) | 14.7% | 3.4% |
Similar Demographics by Disability
Demographics Similar to Immigrants from England by Disability
In terms of disability, the demographic groups most similar to Immigrants from England are British West Indian (12.0%, a difference of 0.050%), Mexican American Indian (12.0%, a difference of 0.050%), Assyrian/Chaldean/Syriac (11.9%, a difference of 0.070%), Belizean (11.9%, a difference of 0.090%), and Immigrants from Western Europe (12.0%, a difference of 0.21%).
| Demographics | Rating | Rank | Disability |
| Barbadians | 15.8 /100 | #195 | Poor 11.9% |
| Serbians | 15.4 /100 | #196 | Poor 11.9% |
| Immigrants | Belize | 15.2 /100 | #197 | Poor 11.9% |
| Ukrainians | 14.7 /100 | #198 | Poor 11.9% |
| Immigrants | Panama | 14.6 /100 | #199 | Poor 11.9% |
| Belizeans | 12.8 /100 | #200 | Poor 11.9% |
| Assyrians/Chaldeans/Syriacs | 12.6 /100 | #201 | Poor 11.9% |
| Immigrants | England | 12.0 /100 | #202 | Poor 12.0% |
| British West Indians | 11.5 /100 | #203 | Poor 12.0% |
| Mexican American Indians | 11.4 /100 | #204 | Poor 12.0% |
| Immigrants | Western Europe | 10.1 /100 | #205 | Poor 12.0% |
| Immigrants | Senegal | 9.4 /100 | #206 | Tragic 12.0% |
| Immigrants | Thailand | 9.3 /100 | #207 | Tragic 12.0% |
| Immigrants | Caribbean | 9.1 /100 | #208 | Tragic 12.0% |
| Danes | 8.7 /100 | #209 | Tragic 12.0% |
Demographics Similar to Argentineans by Disability
In terms of disability, the demographic groups most similar to Argentineans are Cypriot (10.6%, a difference of 0.010%), Immigrants from Malaysia (10.6%, a difference of 0.050%), Egyptian (10.6%, a difference of 0.14%), Immigrants from Argentina (10.6%, a difference of 0.27%), and Immigrants from Turkey (10.6%, a difference of 0.42%).
| Demographics | Rating | Rank | Disability |
| Immigrants | Pakistan | 100.0 /100 | #19 | Exceptional 10.4% |
| Immigrants | Venezuela | 100.0 /100 | #20 | Exceptional 10.4% |
| Asians | 100.0 /100 | #21 | Exceptional 10.4% |
| Immigrants | Sri Lanka | 100.0 /100 | #22 | Exceptional 10.5% |
| Immigrants | Asia | 100.0 /100 | #23 | Exceptional 10.5% |
| Venezuelans | 100.0 /100 | #24 | Exceptional 10.5% |
| Immigrants | Malaysia | 100.0 /100 | #25 | Exceptional 10.6% |
| Argentineans | 100.0 /100 | #26 | Exceptional 10.6% |
| Cypriots | 100.0 /100 | #27 | Exceptional 10.6% |
| Egyptians | 100.0 /100 | #28 | Exceptional 10.6% |
| Immigrants | Argentina | 100.0 /100 | #29 | Exceptional 10.6% |
| Immigrants | Turkey | 100.0 /100 | #30 | Exceptional 10.6% |
| Immigrants | Egypt | 100.0 /100 | #31 | Exceptional 10.6% |
| Paraguayans | 100.0 /100 | #32 | Exceptional 10.6% |
| Immigrants | Kuwait | 100.0 /100 | #33 | Exceptional 10.7% |