Immigrants from El Salvador vs Kenyan Disability Age Under 5
COMPARE
Immigrants from El Salvador
Kenyan
Disability Age Under 5
Disability Age Under 5 Comparison
Immigrants from El Salvador
Kenyans
1.1%
DISABILITY AGE UNDER 5
99.6/ 100
METRIC RATING
54th/ 347
METRIC RANK
1.2%
DISABILITY AGE UNDER 5
75.9/ 100
METRIC RATING
149th/ 347
METRIC RANK
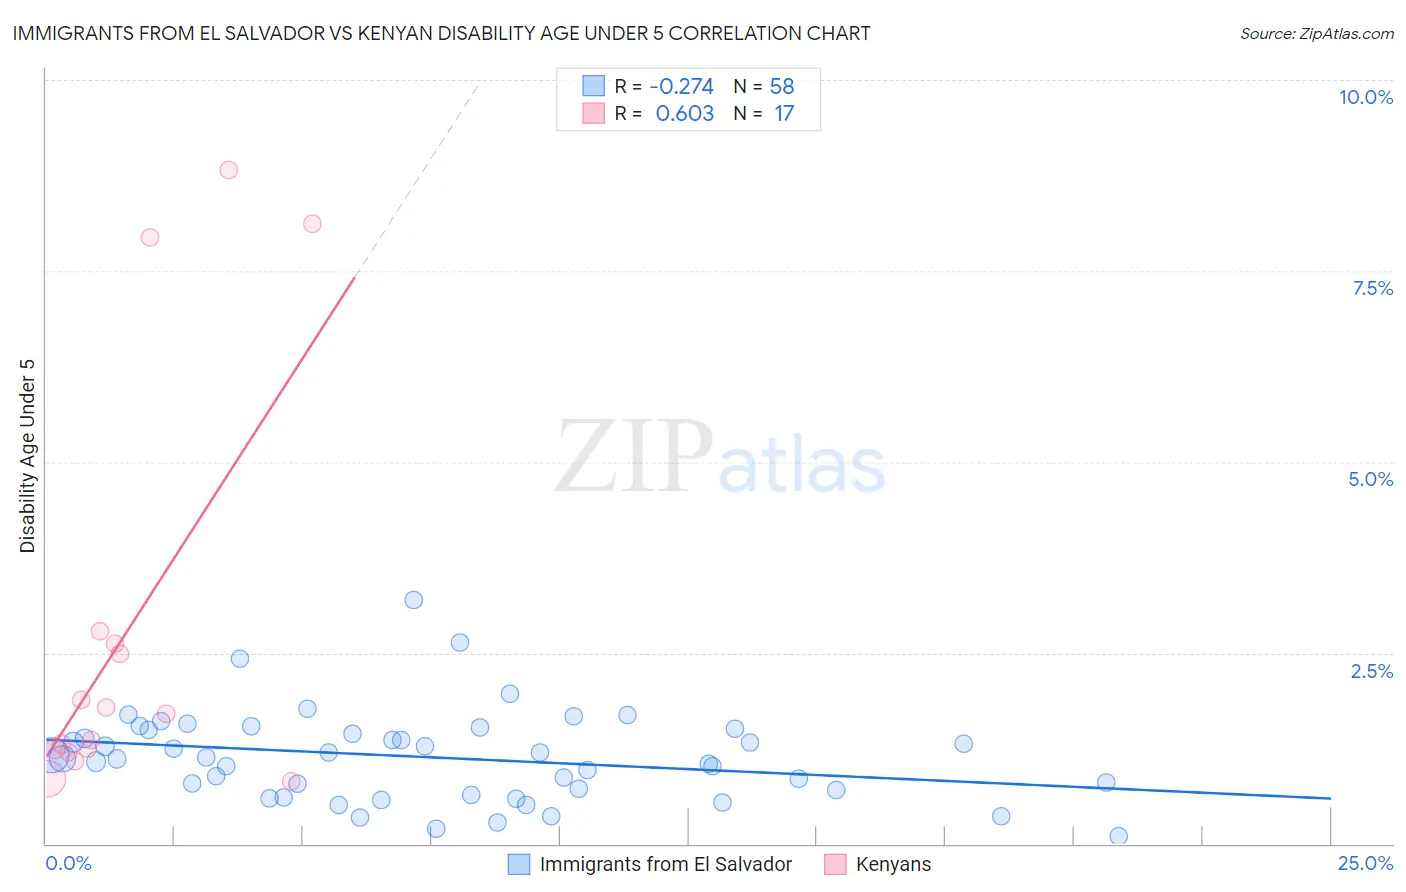
Immigrants from El Salvador vs Kenyan Disability Age Under 5 Correlation Chart
The statistical analysis conducted on geographies consisting of 204,380,401 people shows a weak negative correlation between the proportion of Immigrants from El Salvador and percentage of population with a disability under the age of 5 in the United States with a correlation coefficient (R) of -0.274 and weighted average of 1.1%. Similarly, the statistical analysis conducted on geographies consisting of 118,614,318 people shows a significant positive correlation between the proportion of Kenyans and percentage of population with a disability under the age of 5 in the United States with a correlation coefficient (R) of 0.603 and weighted average of 1.2%, a difference of 11.0%.
Disability Age Under 5 Correlation Summary
| Measurement | Immigrants from El Salvador | Kenyan |
| Minimum | 0.10% | 0.82% |
| Maximum | 3.2% | 8.8% |
| Range | 3.1% | 8.0% |
| Mean | 1.1% | 2.8% |
| Median | 1.1% | 1.7% |
| Interquartile 25% (IQ1) | 0.70% | 1.2% |
| Interquartile 75% (IQ3) | 1.5% | 2.7% |
| Interquartile Range (IQR) | 0.80% | 1.5% |
| Standard Deviation (Sample) | 0.59% | 2.7% |
| Standard Deviation (Population) | 0.58% | 2.6% |
Similar Demographics by Disability Age Under 5
Demographics Similar to Immigrants from El Salvador by Disability Age Under 5
In terms of disability age under 5, the demographic groups most similar to Immigrants from El Salvador are Salvadoran (1.1%, a difference of 0.090%), Asian (1.1%, a difference of 0.29%), Ecuadorian (1.1%, a difference of 0.49%), Assyrian/Chaldean/Syriac (1.1%, a difference of 0.52%), and Immigrants from Bolivia (1.1%, a difference of 0.60%).
| Demographics | Rating | Rank | Disability Age Under 5 |
| Immigrants | Sweden | 99.8 /100 | #47 | Exceptional 1.1% |
| Immigrants | Singapore | 99.7 /100 | #48 | Exceptional 1.1% |
| Immigrants | Russia | 99.7 /100 | #49 | Exceptional 1.1% |
| Immigrants | Japan | 99.7 /100 | #50 | Exceptional 1.1% |
| Immigrants | Kazakhstan | 99.7 /100 | #51 | Exceptional 1.1% |
| Immigrants | Bolivia | 99.6 /100 | #52 | Exceptional 1.1% |
| Asians | 99.6 /100 | #53 | Exceptional 1.1% |
| Immigrants | El Salvador | 99.6 /100 | #54 | Exceptional 1.1% |
| Salvadorans | 99.5 /100 | #55 | Exceptional 1.1% |
| Ecuadorians | 99.5 /100 | #56 | Exceptional 1.1% |
| Assyrians/Chaldeans/Syriacs | 99.5 /100 | #57 | Exceptional 1.1% |
| Immigrants | Egypt | 99.4 /100 | #58 | Exceptional 1.1% |
| Immigrants | Malaysia | 99.4 /100 | #59 | Exceptional 1.1% |
| Immigrants | Western Asia | 99.2 /100 | #60 | Exceptional 1.1% |
| Immigrants | Ethiopia | 99.2 /100 | #61 | Exceptional 1.1% |
Demographics Similar to Kenyans by Disability Age Under 5
In terms of disability age under 5, the demographic groups most similar to Kenyans are South American (1.2%, a difference of 0.040%), Ghanaian (1.2%, a difference of 0.050%), Icelander (1.2%, a difference of 0.060%), Yaqui (1.2%, a difference of 0.14%), and Samoan (1.2%, a difference of 0.23%).
| Demographics | Rating | Rank | Disability Age Under 5 |
| Immigrants | Colombia | 79.3 /100 | #142 | Good 1.2% |
| Alsatians | 79.3 /100 | #143 | Good 1.2% |
| Immigrants | Middle Africa | 79.3 /100 | #144 | Good 1.2% |
| Immigrants | Zimbabwe | 77.9 /100 | #145 | Good 1.2% |
| Samoans | 77.7 /100 | #146 | Good 1.2% |
| Icelanders | 76.3 /100 | #147 | Good 1.2% |
| Ghanaians | 76.3 /100 | #148 | Good 1.2% |
| Kenyans | 75.9 /100 | #149 | Good 1.2% |
| South Americans | 75.6 /100 | #150 | Good 1.2% |
| Yaqui | 74.8 /100 | #151 | Good 1.2% |
| Hondurans | 72.5 /100 | #152 | Good 1.2% |
| Immigrants | Thailand | 69.4 /100 | #153 | Good 1.2% |
| Uruguayans | 68.8 /100 | #154 | Good 1.2% |
| Immigrants | Ghana | 68.7 /100 | #155 | Good 1.2% |
| Hawaiians | 68.5 /100 | #156 | Good 1.2% |