Immigrants from El Salvador vs Taiwanese Disability Age Under 5
COMPARE
Immigrants from El Salvador
Taiwanese
Disability Age Under 5
Disability Age Under 5 Comparison
Immigrants from El Salvador
Taiwanese
1.1%
DISABILITY AGE UNDER 5
99.6/ 100
METRIC RATING
54th/ 347
METRIC RANK
1.3%
DISABILITY AGE UNDER 5
6.1/ 100
METRIC RATING
227th/ 347
METRIC RANK
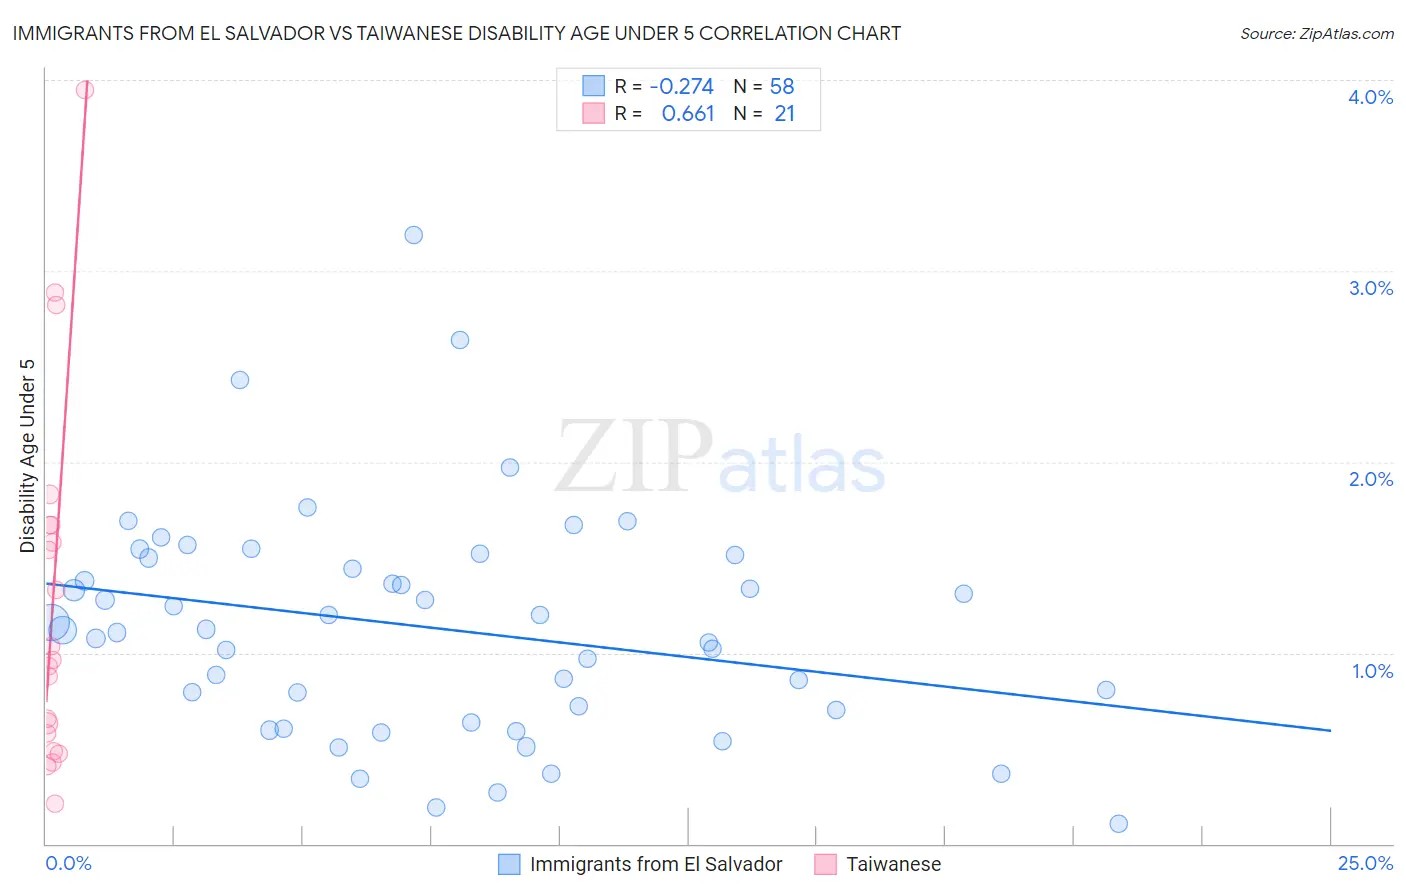
Immigrants from El Salvador vs Taiwanese Disability Age Under 5 Correlation Chart
The statistical analysis conducted on geographies consisting of 204,380,401 people shows a weak negative correlation between the proportion of Immigrants from El Salvador and percentage of population with a disability under the age of 5 in the United States with a correlation coefficient (R) of -0.274 and weighted average of 1.1%. Similarly, the statistical analysis conducted on geographies consisting of 29,016,682 people shows a significant positive correlation between the proportion of Taiwanese and percentage of population with a disability under the age of 5 in the United States with a correlation coefficient (R) of 0.661 and weighted average of 1.3%, a difference of 21.0%.
Disability Age Under 5 Correlation Summary
| Measurement | Immigrants from El Salvador | Taiwanese |
| Minimum | 0.10% | 0.21% |
| Maximum | 3.2% | 4.0% |
| Range | 3.1% | 3.7% |
| Mean | 1.1% | 1.3% |
| Median | 1.1% | 0.96% |
| Interquartile 25% (IQ1) | 0.70% | 0.53% |
| Interquartile 75% (IQ3) | 1.5% | 1.7% |
| Interquartile Range (IQR) | 0.80% | 1.1% |
| Standard Deviation (Sample) | 0.59% | 0.96% |
| Standard Deviation (Population) | 0.58% | 0.94% |
Similar Demographics by Disability Age Under 5
Demographics Similar to Immigrants from El Salvador by Disability Age Under 5
In terms of disability age under 5, the demographic groups most similar to Immigrants from El Salvador are Salvadoran (1.1%, a difference of 0.090%), Asian (1.1%, a difference of 0.29%), Ecuadorian (1.1%, a difference of 0.49%), Assyrian/Chaldean/Syriac (1.1%, a difference of 0.52%), and Immigrants from Bolivia (1.1%, a difference of 0.60%).
| Demographics | Rating | Rank | Disability Age Under 5 |
| Immigrants | Sweden | 99.8 /100 | #47 | Exceptional 1.1% |
| Immigrants | Singapore | 99.7 /100 | #48 | Exceptional 1.1% |
| Immigrants | Russia | 99.7 /100 | #49 | Exceptional 1.1% |
| Immigrants | Japan | 99.7 /100 | #50 | Exceptional 1.1% |
| Immigrants | Kazakhstan | 99.7 /100 | #51 | Exceptional 1.1% |
| Immigrants | Bolivia | 99.6 /100 | #52 | Exceptional 1.1% |
| Asians | 99.6 /100 | #53 | Exceptional 1.1% |
| Immigrants | El Salvador | 99.6 /100 | #54 | Exceptional 1.1% |
| Salvadorans | 99.5 /100 | #55 | Exceptional 1.1% |
| Ecuadorians | 99.5 /100 | #56 | Exceptional 1.1% |
| Assyrians/Chaldeans/Syriacs | 99.5 /100 | #57 | Exceptional 1.1% |
| Immigrants | Egypt | 99.4 /100 | #58 | Exceptional 1.1% |
| Immigrants | Malaysia | 99.4 /100 | #59 | Exceptional 1.1% |
| Immigrants | Western Asia | 99.2 /100 | #60 | Exceptional 1.1% |
| Immigrants | Ethiopia | 99.2 /100 | #61 | Exceptional 1.1% |
Demographics Similar to Taiwanese by Disability Age Under 5
In terms of disability age under 5, the demographic groups most similar to Taiwanese are Luxembourger (1.3%, a difference of 0.010%), Immigrants from Costa Rica (1.3%, a difference of 0.23%), Lebanese (1.3%, a difference of 0.32%), Panamanian (1.3%, a difference of 0.34%), and Bahamian (1.3%, a difference of 0.34%).
| Demographics | Rating | Rank | Disability Age Under 5 |
| Serbians | 9.6 /100 | #220 | Tragic 1.3% |
| Sub-Saharan Africans | 8.3 /100 | #221 | Tragic 1.3% |
| Ukrainians | 8.3 /100 | #222 | Tragic 1.3% |
| Hispanics or Latinos | 7.7 /100 | #223 | Tragic 1.3% |
| Latvians | 7.1 /100 | #224 | Tragic 1.3% |
| Panamanians | 7.1 /100 | #225 | Tragic 1.3% |
| Bahamians | 7.1 /100 | #226 | Tragic 1.3% |
| Taiwanese | 6.1 /100 | #227 | Tragic 1.3% |
| Luxembourgers | 6.1 /100 | #228 | Tragic 1.3% |
| Immigrants | Costa Rica | 5.5 /100 | #229 | Tragic 1.3% |
| Lebanese | 5.3 /100 | #230 | Tragic 1.3% |
| Immigrants | Northern Europe | 4.7 /100 | #231 | Tragic 1.3% |
| French American Indians | 4.5 /100 | #232 | Tragic 1.3% |
| Tongans | 4.2 /100 | #233 | Tragic 1.3% |
| Pueblo | 3.8 /100 | #234 | Tragic 1.3% |