Immigrants from El Salvador vs Immigrants from Eastern Asia Vision Disability
COMPARE
Immigrants from El Salvador
Immigrants from Eastern Asia
Vision Disability
Vision Disability Comparison
Immigrants from El Salvador
Immigrants from Eastern Asia
2.2%
VISION DISABILITY
21.0/ 100
METRIC RATING
199th/ 347
METRIC RANK
1.8%
VISION DISABILITY
100.0/ 100
METRIC RATING
13th/ 347
METRIC RANK
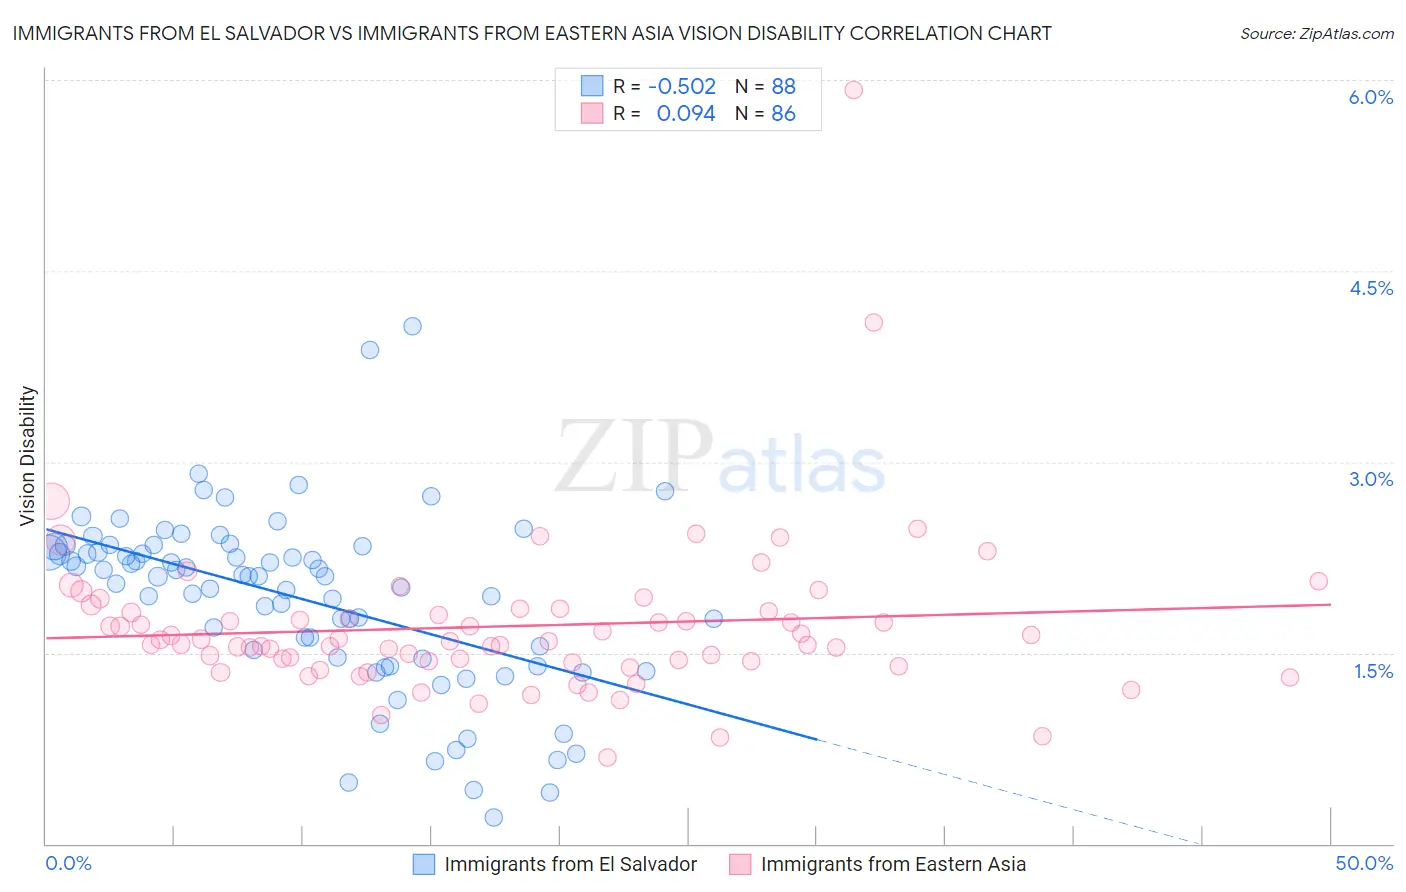
Immigrants from El Salvador vs Immigrants from Eastern Asia Vision Disability Correlation Chart
The statistical analysis conducted on geographies consisting of 357,605,888 people shows a substantial negative correlation between the proportion of Immigrants from El Salvador and percentage of population with vision disability in the United States with a correlation coefficient (R) of -0.502 and weighted average of 2.2%. Similarly, the statistical analysis conducted on geographies consisting of 499,136,938 people shows a slight positive correlation between the proportion of Immigrants from Eastern Asia and percentage of population with vision disability in the United States with a correlation coefficient (R) of 0.094 and weighted average of 1.8%, a difference of 20.8%.
Vision Disability Correlation Summary
| Measurement | Immigrants from El Salvador | Immigrants from Eastern Asia |
| Minimum | 0.21% | 0.68% |
| Maximum | 4.1% | 5.9% |
| Range | 3.9% | 5.2% |
| Mean | 1.9% | 1.7% |
| Median | 2.1% | 1.6% |
| Interquartile 25% (IQ1) | 1.5% | 1.4% |
| Interquartile 75% (IQ3) | 2.3% | 1.8% |
| Interquartile Range (IQR) | 0.86% | 0.40% |
| Standard Deviation (Sample) | 0.70% | 0.65% |
| Standard Deviation (Population) | 0.69% | 0.65% |
Similar Demographics by Vision Disability
Demographics Similar to Immigrants from El Salvador by Vision Disability
In terms of vision disability, the demographic groups most similar to Immigrants from El Salvador are Czechoslovakian (2.2%, a difference of 0.050%), Ghanaian (2.2%, a difference of 0.070%), Immigrants from Thailand (2.2%, a difference of 0.090%), Immigrants from Grenada (2.2%, a difference of 0.18%), and Slovak (2.2%, a difference of 0.21%).
| Demographics | Rating | Rank | Vision Disability |
| Europeans | 25.7 /100 | #192 | Fair 2.2% |
| British | 25.1 /100 | #193 | Fair 2.2% |
| Immigrants | Barbados | 24.0 /100 | #194 | Fair 2.2% |
| Immigrants | Immigrants | 23.7 /100 | #195 | Fair 2.2% |
| Immigrants | Grenada | 23.1 /100 | #196 | Fair 2.2% |
| Ghanaians | 21.8 /100 | #197 | Fair 2.2% |
| Czechoslovakians | 21.6 /100 | #198 | Fair 2.2% |
| Immigrants | El Salvador | 21.0 /100 | #199 | Fair 2.2% |
| Immigrants | Thailand | 20.1 /100 | #200 | Fair 2.2% |
| Slovaks | 18.8 /100 | #201 | Poor 2.2% |
| Immigrants | Zaire | 18.0 /100 | #202 | Poor 2.2% |
| Dutch | 17.1 /100 | #203 | Poor 2.2% |
| Immigrants | Guyana | 15.9 /100 | #204 | Poor 2.2% |
| Samoans | 15.7 /100 | #205 | Poor 2.2% |
| Pennsylvania Germans | 14.5 /100 | #206 | Poor 2.2% |
Demographics Similar to Immigrants from Eastern Asia by Vision Disability
In terms of vision disability, the demographic groups most similar to Immigrants from Eastern Asia are Immigrants from Korea (1.8%, a difference of 0.080%), Immigrants from China (1.8%, a difference of 0.15%), Immigrants from Israel (1.8%, a difference of 0.31%), Immigrants from Bolivia (1.8%, a difference of 0.57%), and Indian (Asian) (1.8%, a difference of 1.0%).
| Demographics | Rating | Rank | Vision Disability |
| Immigrants | Iran | 100.0 /100 | #6 | Exceptional 1.8% |
| Immigrants | South Central Asia | 100.0 /100 | #7 | Exceptional 1.8% |
| Iranians | 100.0 /100 | #8 | Exceptional 1.8% |
| Immigrants | Singapore | 100.0 /100 | #9 | Exceptional 1.8% |
| Immigrants | Hong Kong | 100.0 /100 | #10 | Exceptional 1.8% |
| Immigrants | Israel | 100.0 /100 | #11 | Exceptional 1.8% |
| Immigrants | Korea | 100.0 /100 | #12 | Exceptional 1.8% |
| Immigrants | Eastern Asia | 100.0 /100 | #13 | Exceptional 1.8% |
| Immigrants | China | 100.0 /100 | #14 | Exceptional 1.8% |
| Immigrants | Bolivia | 100.0 /100 | #15 | Exceptional 1.8% |
| Indians (Asian) | 100.0 /100 | #16 | Exceptional 1.8% |
| Burmese | 100.0 /100 | #17 | Exceptional 1.8% |
| Bolivians | 100.0 /100 | #18 | Exceptional 1.9% |
| Immigrants | Sri Lanka | 100.0 /100 | #19 | Exceptional 1.9% |
| Asians | 100.0 /100 | #20 | Exceptional 1.9% |