Immigrants from Ecuador vs Mongolian Median Female Earnings
COMPARE
Immigrants from Ecuador
Mongolian
Median Female Earnings
Median Female Earnings Comparison
Immigrants from Ecuador
Mongolians
$38,644
MEDIAN FEMALE EARNINGS
10.1/ 100
METRIC RATING
216th/ 347
METRIC RANK
$42,542
MEDIAN FEMALE EARNINGS
99.7/ 100
METRIC RATING
73rd/ 347
METRIC RANK
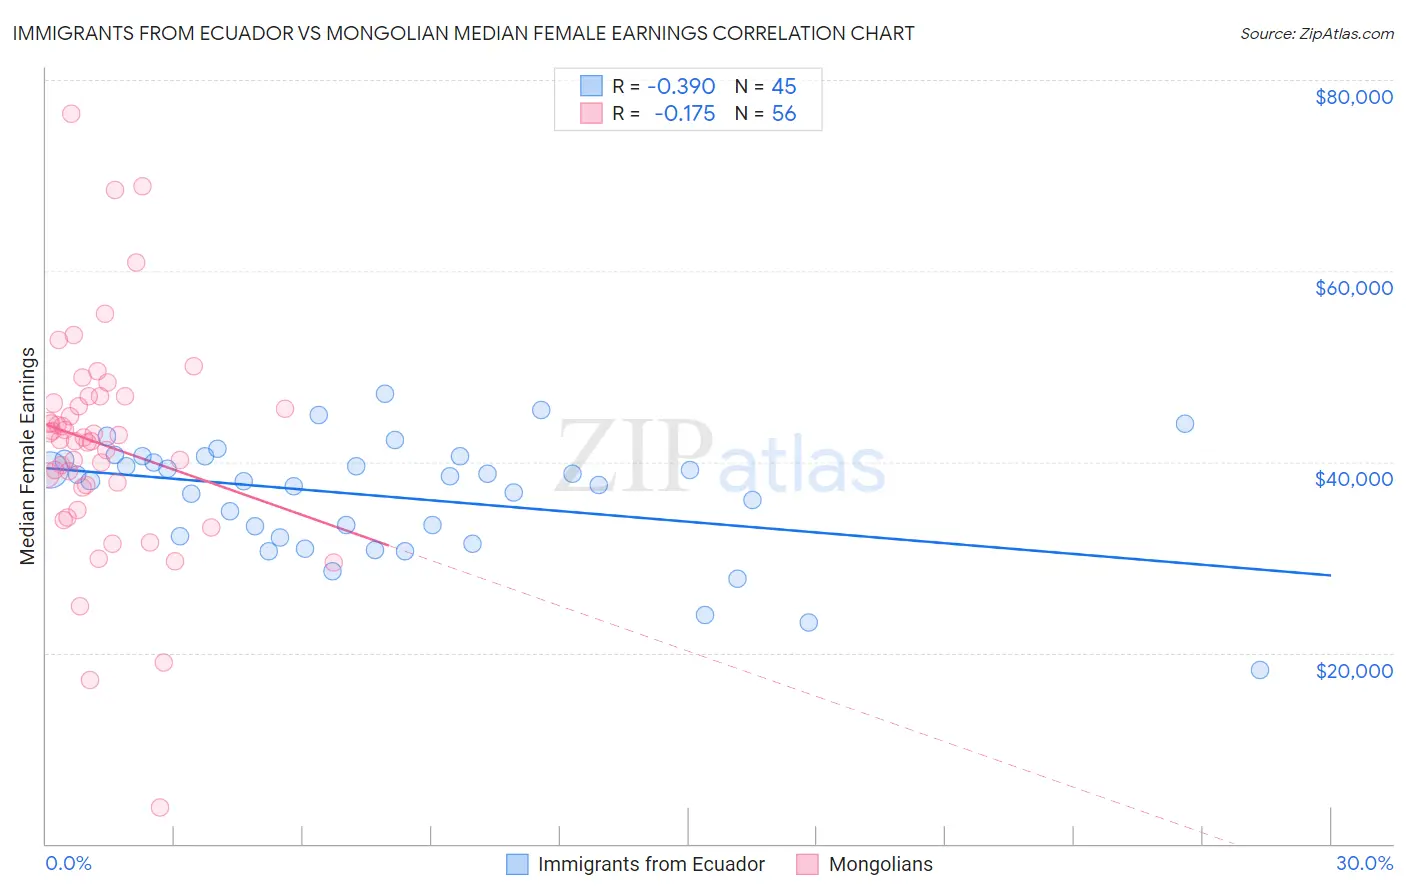
Immigrants from Ecuador vs Mongolian Median Female Earnings Correlation Chart
The statistical analysis conducted on geographies consisting of 270,943,793 people shows a mild negative correlation between the proportion of Immigrants from Ecuador and median female earnings in the United States with a correlation coefficient (R) of -0.390 and weighted average of $38,644. Similarly, the statistical analysis conducted on geographies consisting of 140,350,842 people shows a poor negative correlation between the proportion of Mongolians and median female earnings in the United States with a correlation coefficient (R) of -0.175 and weighted average of $42,542, a difference of 10.1%.
Median Female Earnings Correlation Summary
| Measurement | Immigrants from Ecuador | Mongolian |
| Minimum | $18,150 | $3,764 |
| Maximum | $47,087 | $76,486 |
| Range | $28,937 | $72,722 |
| Mean | $36,378 | $41,823 |
| Median | $37,998 | $42,408 |
| Interquartile 25% (IQ1) | $32,167 | $37,469 |
| Interquartile 75% (IQ3) | $40,357 | $46,493 |
| Interquartile Range (IQR) | $8,190 | $9,024 |
| Standard Deviation (Sample) | $6,055 | $11,821 |
| Standard Deviation (Population) | $5,987 | $11,715 |
Similar Demographics by Median Female Earnings
Demographics Similar to Immigrants from Ecuador by Median Female Earnings
In terms of median female earnings, the demographic groups most similar to Immigrants from Ecuador are Spaniard ($38,656, a difference of 0.030%), Immigrants from Jamaica ($38,625, a difference of 0.050%), Iraqi ($38,666, a difference of 0.060%), Jamaican ($38,670, a difference of 0.070%), and Cape Verdean ($38,614, a difference of 0.080%).
| Demographics | Rating | Rank | Median Female Earnings |
| Norwegians | 13.4 /100 | #209 | Poor $38,802 |
| Czechoslovakians | 12.0 /100 | #210 | Poor $38,738 |
| Aleuts | 11.6 /100 | #211 | Poor $38,719 |
| Guamanians/Chamorros | 11.5 /100 | #212 | Poor $38,717 |
| Jamaicans | 10.5 /100 | #213 | Poor $38,670 |
| Iraqis | 10.5 /100 | #214 | Poor $38,666 |
| Spaniards | 10.3 /100 | #215 | Poor $38,656 |
| Immigrants | Ecuador | 10.1 /100 | #216 | Poor $38,644 |
| Immigrants | Jamaica | 9.7 /100 | #217 | Tragic $38,625 |
| Cape Verdeans | 9.5 /100 | #218 | Tragic $38,614 |
| Nepalese | 9.3 /100 | #219 | Tragic $38,603 |
| Yugoslavians | 8.8 /100 | #220 | Tragic $38,573 |
| Immigrants | Azores | 8.8 /100 | #221 | Tragic $38,573 |
| Japanese | 8.1 /100 | #222 | Tragic $38,528 |
| Immigrants | Sudan | 7.8 /100 | #223 | Tragic $38,511 |
Demographics Similar to Mongolians by Median Female Earnings
In terms of median female earnings, the demographic groups most similar to Mongolians are Immigrants from South Africa ($42,508, a difference of 0.080%), Albanian ($42,584, a difference of 0.10%), New Zealander ($42,446, a difference of 0.23%), Immigrants from Italy ($42,446, a difference of 0.23%), and Immigrants from Albania ($42,388, a difference of 0.36%).
| Demographics | Rating | Rank | Median Female Earnings |
| Immigrants | Norway | 99.9 /100 | #66 | Exceptional $42,837 |
| Immigrants | Egypt | 99.9 /100 | #67 | Exceptional $42,837 |
| Immigrants | Austria | 99.8 /100 | #68 | Exceptional $42,824 |
| Immigrants | Spain | 99.8 /100 | #69 | Exceptional $42,815 |
| Immigrants | Ethiopia | 99.8 /100 | #70 | Exceptional $42,744 |
| Immigrants | Romania | 99.8 /100 | #71 | Exceptional $42,718 |
| Albanians | 99.8 /100 | #72 | Exceptional $42,584 |
| Mongolians | 99.7 /100 | #73 | Exceptional $42,542 |
| Immigrants | South Africa | 99.7 /100 | #74 | Exceptional $42,508 |
| New Zealanders | 99.7 /100 | #75 | Exceptional $42,446 |
| Immigrants | Italy | 99.7 /100 | #76 | Exceptional $42,446 |
| Immigrants | Albania | 99.6 /100 | #77 | Exceptional $42,388 |
| Immigrants | Kazakhstan | 99.6 /100 | #78 | Exceptional $42,386 |
| Greeks | 99.6 /100 | #79 | Exceptional $42,336 |
| Immigrants | Moldova | 99.6 /100 | #80 | Exceptional $42,304 |