Immigrants from Eastern Europe vs Immigrants from Belarus Vision Disability
COMPARE
Immigrants from Eastern Europe
Immigrants from Belarus
Vision Disability
Vision Disability Comparison
Immigrants from Eastern Europe
Immigrants from Belarus
2.0%
VISION DISABILITY
98.3/ 100
METRIC RATING
78th/ 347
METRIC RANK
2.0%
VISION DISABILITY
99.3/ 100
METRIC RATING
53rd/ 347
METRIC RANK
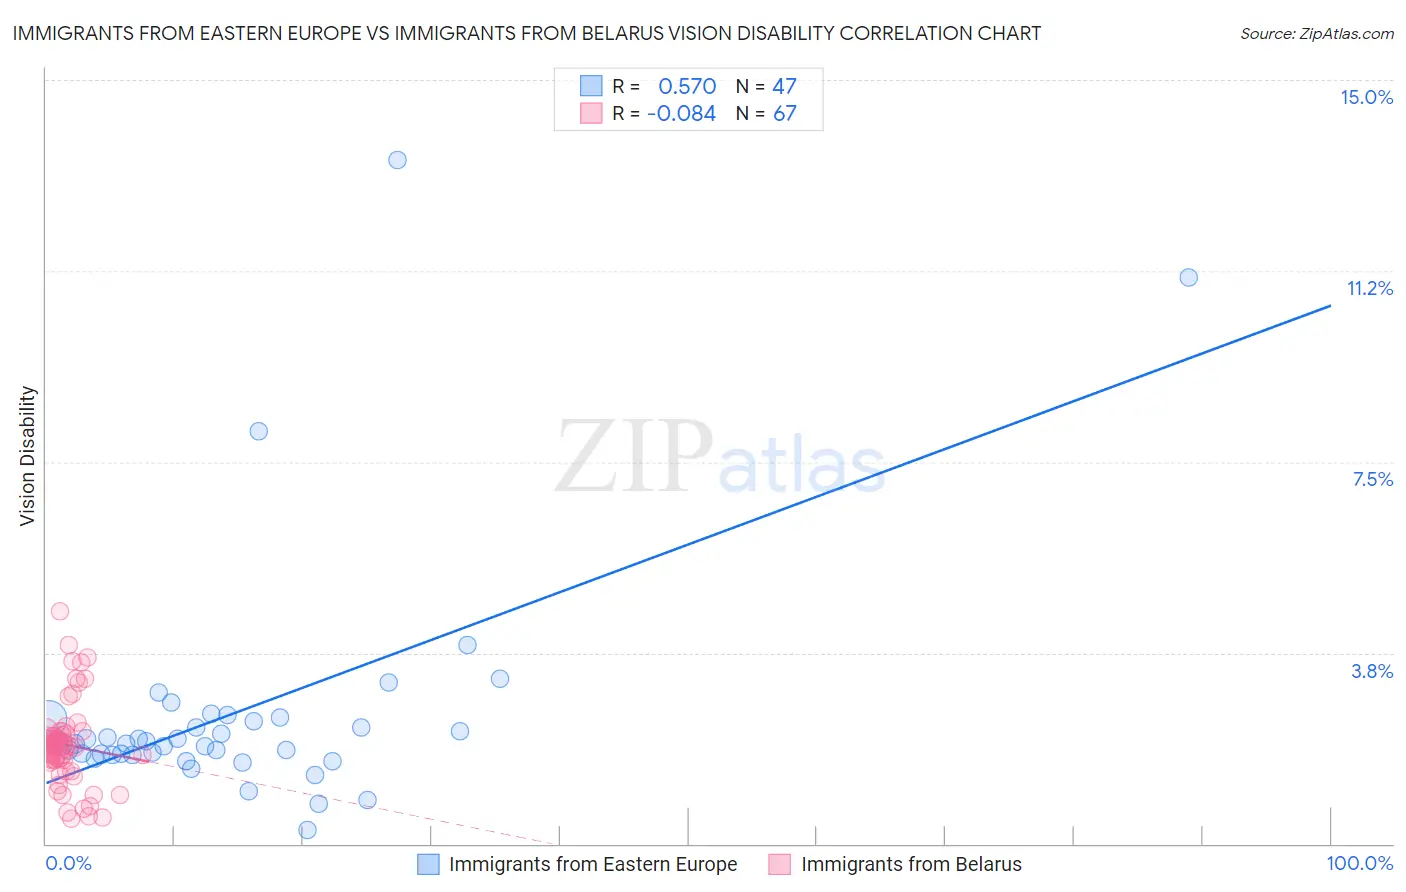
Immigrants from Eastern Europe vs Immigrants from Belarus Vision Disability Correlation Chart
The statistical analysis conducted on geographies consisting of 475,183,449 people shows a substantial positive correlation between the proportion of Immigrants from Eastern Europe and percentage of population with vision disability in the United States with a correlation coefficient (R) of 0.570 and weighted average of 2.0%. Similarly, the statistical analysis conducted on geographies consisting of 150,159,443 people shows a slight negative correlation between the proportion of Immigrants from Belarus and percentage of population with vision disability in the United States with a correlation coefficient (R) of -0.084 and weighted average of 2.0%, a difference of 1.7%.
Vision Disability Correlation Summary
| Measurement | Immigrants from Eastern Europe | Immigrants from Belarus |
| Minimum | 0.27% | 0.50% |
| Maximum | 13.4% | 4.6% |
| Range | 13.2% | 4.1% |
| Mean | 2.6% | 1.9% |
| Median | 2.0% | 1.9% |
| Interquartile 25% (IQ1) | 1.8% | 1.6% |
| Interquartile 75% (IQ3) | 2.4% | 2.2% |
| Interquartile Range (IQR) | 0.70% | 0.52% |
| Standard Deviation (Sample) | 2.3% | 0.82% |
| Standard Deviation (Population) | 2.3% | 0.81% |
Similar Demographics by Vision Disability
Demographics Similar to Immigrants from Eastern Europe by Vision Disability
In terms of vision disability, the demographic groups most similar to Immigrants from Eastern Europe are Paraguayan (2.0%, a difference of 0.030%), Immigrants from Jordan (2.0%, a difference of 0.030%), Palestinian (2.0%, a difference of 0.050%), Immigrants from North Macedonia (2.0%, a difference of 0.050%), and Immigrants from Eritrea (2.0%, a difference of 0.11%).
| Demographics | Rating | Rank | Vision Disability |
| Immigrants | Northern Europe | 98.6 /100 | #71 | Exceptional 2.0% |
| Immigrants | France | 98.5 /100 | #72 | Exceptional 2.0% |
| Immigrants | Eritrea | 98.4 /100 | #73 | Exceptional 2.0% |
| Palestinians | 98.3 /100 | #74 | Exceptional 2.0% |
| Immigrants | North Macedonia | 98.3 /100 | #75 | Exceptional 2.0% |
| Paraguayans | 98.3 /100 | #76 | Exceptional 2.0% |
| Immigrants | Jordan | 98.3 /100 | #77 | Exceptional 2.0% |
| Immigrants | Eastern Europe | 98.3 /100 | #78 | Exceptional 2.0% |
| Assyrians/Chaldeans/Syriacs | 98.1 /100 | #79 | Exceptional 2.0% |
| Lithuanians | 97.7 /100 | #80 | Exceptional 2.0% |
| Soviet Union | 97.6 /100 | #81 | Exceptional 2.0% |
| Immigrants | Poland | 97.6 /100 | #82 | Exceptional 2.0% |
| Immigrants | Western Asia | 97.5 /100 | #83 | Exceptional 2.0% |
| Immigrants | Latvia | 97.3 /100 | #84 | Exceptional 2.0% |
| Chinese | 97.2 /100 | #85 | Exceptional 2.0% |
Demographics Similar to Immigrants from Belarus by Vision Disability
In terms of vision disability, the demographic groups most similar to Immigrants from Belarus are Macedonian (2.0%, a difference of 0.040%), Laotian (2.0%, a difference of 0.090%), Immigrants from Serbia (2.0%, a difference of 0.11%), Jordanian (2.0%, a difference of 0.26%), and Somali (2.0%, a difference of 0.28%).
| Demographics | Rating | Rank | Vision Disability |
| Immigrants | Sweden | 99.7 /100 | #46 | Exceptional 2.0% |
| Immigrants | Bulgaria | 99.7 /100 | #47 | Exceptional 2.0% |
| Israelis | 99.6 /100 | #48 | Exceptional 2.0% |
| Latvians | 99.5 /100 | #49 | Exceptional 2.0% |
| Afghans | 99.5 /100 | #50 | Exceptional 2.0% |
| Tongans | 99.5 /100 | #51 | Exceptional 2.0% |
| Immigrants | Serbia | 99.4 /100 | #52 | Exceptional 2.0% |
| Immigrants | Belarus | 99.3 /100 | #53 | Exceptional 2.0% |
| Macedonians | 99.3 /100 | #54 | Exceptional 2.0% |
| Laotians | 99.3 /100 | #55 | Exceptional 2.0% |
| Jordanians | 99.2 /100 | #56 | Exceptional 2.0% |
| Somalis | 99.2 /100 | #57 | Exceptional 2.0% |
| Immigrants | Saudi Arabia | 99.2 /100 | #58 | Exceptional 2.0% |
| Argentineans | 99.1 /100 | #59 | Exceptional 2.0% |
| Immigrants | Romania | 99.1 /100 | #60 | Exceptional 2.0% |