Immigrants from Eastern Africa vs Immigrants from Jordan Disability
COMPARE
Immigrants from Eastern Africa
Immigrants from Jordan
Disability
Disability Comparison
Immigrants from Eastern Africa
Immigrants from Jordan
11.3%
DISABILITY
96.7/ 100
METRIC RATING
102nd/ 347
METRIC RANK
11.1%
DISABILITY
99.3/ 100
METRIC RATING
79th/ 347
METRIC RANK
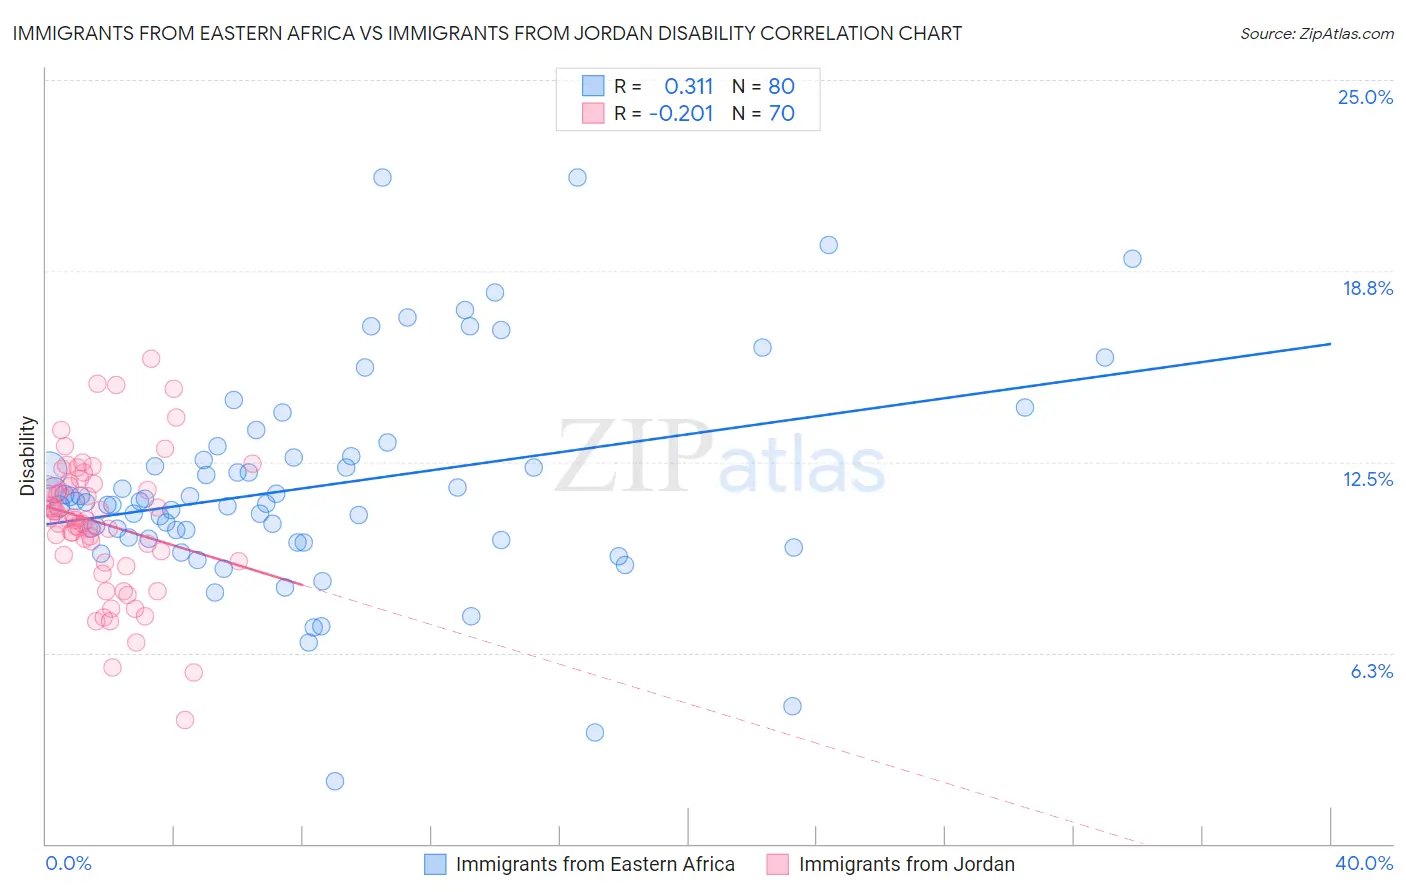
Immigrants from Eastern Africa vs Immigrants from Jordan Disability Correlation Chart
The statistical analysis conducted on geographies consisting of 355,125,072 people shows a mild positive correlation between the proportion of Immigrants from Eastern Africa and percentage of population with a disability in the United States with a correlation coefficient (R) of 0.311 and weighted average of 11.3%. Similarly, the statistical analysis conducted on geographies consisting of 181,277,491 people shows a weak negative correlation between the proportion of Immigrants from Jordan and percentage of population with a disability in the United States with a correlation coefficient (R) of -0.201 and weighted average of 11.1%, a difference of 1.9%.
Disability Correlation Summary
| Measurement | Immigrants from Eastern Africa | Immigrants from Jordan |
| Minimum | 2.1% | 4.0% |
| Maximum | 21.8% | 15.9% |
| Range | 19.7% | 11.8% |
| Mean | 11.7% | 10.5% |
| Median | 11.2% | 10.6% |
| Interquartile 25% (IQ1) | 10.0% | 9.2% |
| Interquartile 75% (IQ3) | 12.7% | 11.8% |
| Interquartile Range (IQR) | 2.7% | 2.5% |
| Standard Deviation (Sample) | 3.5% | 2.3% |
| Standard Deviation (Population) | 3.5% | 2.2% |
Similar Demographics by Disability
Demographics Similar to Immigrants from Eastern Africa by Disability
In terms of disability, the demographic groups most similar to Immigrants from Eastern Africa are Immigrants from Nicaragua (11.3%, a difference of 0.060%), Immigrants from Uruguay (11.3%, a difference of 0.070%), Immigrants (11.3%, a difference of 0.080%), Immigrants from Kazakhstan (11.3%, a difference of 0.090%), and Immigrants from Greece (11.3%, a difference of 0.11%).
| Demographics | Rating | Rank | Disability |
| Eastern Europeans | 97.8 /100 | #95 | Exceptional 11.2% |
| Immigrants | Zimbabwe | 97.7 /100 | #96 | Exceptional 11.2% |
| Bhutanese | 97.4 /100 | #97 | Exceptional 11.2% |
| Uruguayans | 97.4 /100 | #98 | Exceptional 11.2% |
| Immigrants | Czechoslovakia | 97.4 /100 | #99 | Exceptional 11.2% |
| Immigrants | Greece | 96.9 /100 | #100 | Exceptional 11.3% |
| Immigrants | Nicaragua | 96.8 /100 | #101 | Exceptional 11.3% |
| Immigrants | Eastern Africa | 96.7 /100 | #102 | Exceptional 11.3% |
| Immigrants | Uruguay | 96.4 /100 | #103 | Exceptional 11.3% |
| Immigrants | Immigrants | 96.4 /100 | #104 | Exceptional 11.3% |
| Immigrants | Kazakhstan | 96.4 /100 | #105 | Exceptional 11.3% |
| Immigrants | Eastern Europe | 96.3 /100 | #106 | Exceptional 11.3% |
| Nicaraguans | 96.2 /100 | #107 | Exceptional 11.3% |
| Immigrants | Nigeria | 96.0 /100 | #108 | Exceptional 11.3% |
| Immigrants | Uganda | 95.7 /100 | #109 | Exceptional 11.3% |
Demographics Similar to Immigrants from Jordan by Disability
In terms of disability, the demographic groups most similar to Immigrants from Jordan are Immigrants from Cameroon (11.1%, a difference of 0.040%), Immigrants from Ireland (11.1%, a difference of 0.050%), Immigrants from Belgium (11.0%, a difference of 0.070%), Sierra Leonean (11.0%, a difference of 0.080%), and Immigrants from Vietnam (11.0%, a difference of 0.10%).
| Demographics | Rating | Rank | Disability |
| Immigrants | Chile | 99.4 /100 | #72 | Exceptional 11.0% |
| Immigrants | Bangladesh | 99.4 /100 | #73 | Exceptional 11.0% |
| Immigrants | Serbia | 99.4 /100 | #74 | Exceptional 11.0% |
| Immigrants | Vietnam | 99.4 /100 | #75 | Exceptional 11.0% |
| Sierra Leoneans | 99.3 /100 | #76 | Exceptional 11.0% |
| Immigrants | Belgium | 99.3 /100 | #77 | Exceptional 11.0% |
| Immigrants | Cameroon | 99.3 /100 | #78 | Exceptional 11.1% |
| Immigrants | Jordan | 99.3 /100 | #79 | Exceptional 11.1% |
| Immigrants | Ireland | 99.3 /100 | #80 | Exceptional 11.1% |
| Immigrants | Poland | 99.1 /100 | #81 | Exceptional 11.1% |
| Chileans | 99.1 /100 | #82 | Exceptional 11.1% |
| Immigrants | Switzerland | 99.0 /100 | #83 | Exceptional 11.1% |
| Immigrants | Sierra Leone | 99.0 /100 | #84 | Exceptional 11.1% |
| Immigrants | Belarus | 98.9 /100 | #85 | Exceptional 11.1% |
| Immigrants | Russia | 98.9 /100 | #86 | Exceptional 11.1% |