Immigrants from Eastern Africa vs Colville Disability
COMPARE
Immigrants from Eastern Africa
Colville
Disability
Disability Comparison
Immigrants from Eastern Africa
Colville
11.3%
DISABILITY
96.7/ 100
METRIC RATING
102nd/ 347
METRIC RANK
15.8%
DISABILITY
0.0/ 100
METRIC RATING
344th/ 347
METRIC RANK
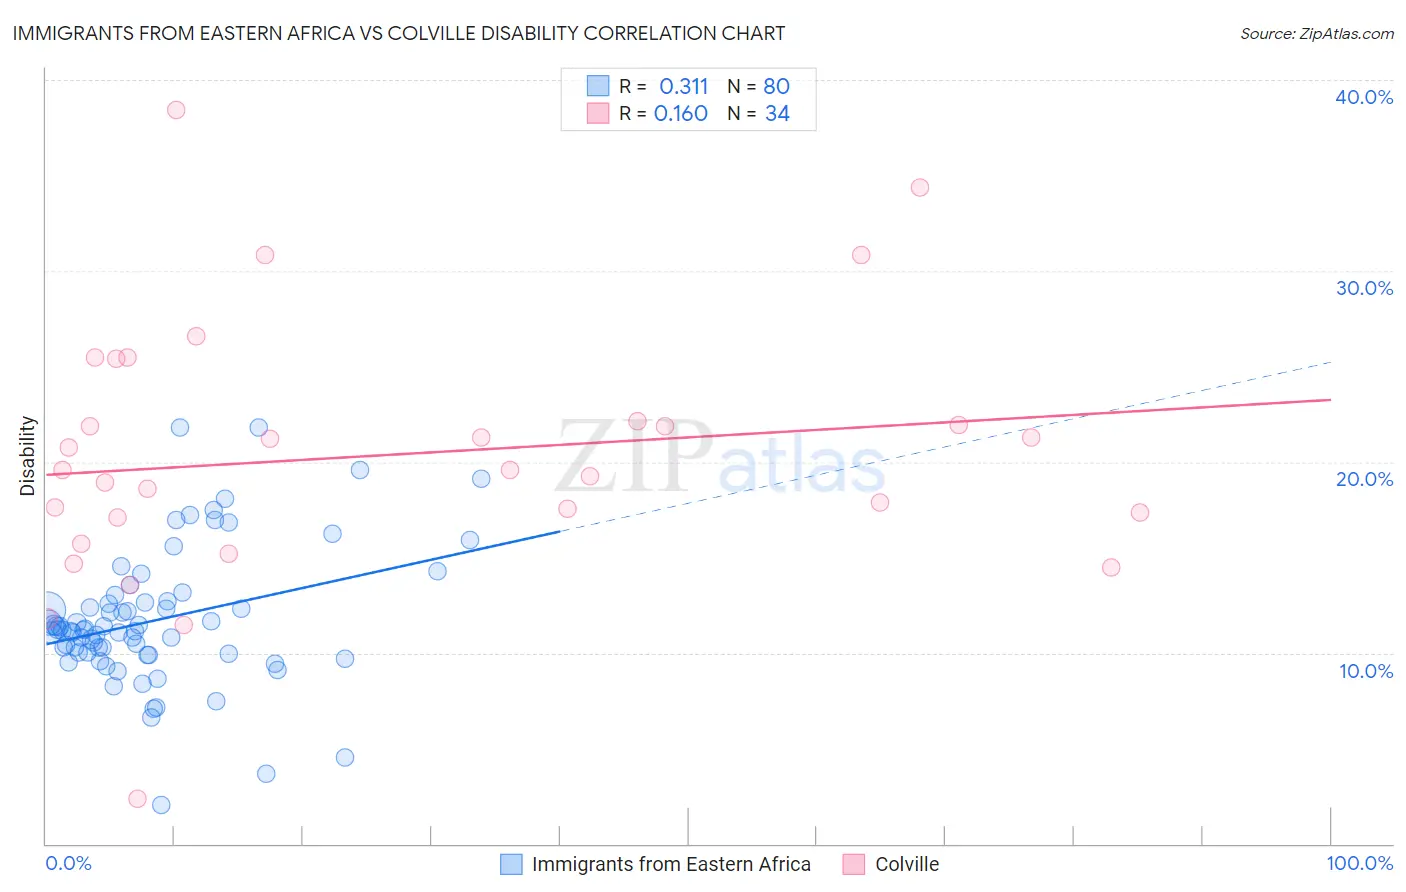
Immigrants from Eastern Africa vs Colville Disability Correlation Chart
The statistical analysis conducted on geographies consisting of 355,125,072 people shows a mild positive correlation between the proportion of Immigrants from Eastern Africa and percentage of population with a disability in the United States with a correlation coefficient (R) of 0.311 and weighted average of 11.3%. Similarly, the statistical analysis conducted on geographies consisting of 34,687,707 people shows a poor positive correlation between the proportion of Colville and percentage of population with a disability in the United States with a correlation coefficient (R) of 0.160 and weighted average of 15.8%, a difference of 40.2%.
Disability Correlation Summary
| Measurement | Immigrants from Eastern Africa | Colville |
| Minimum | 2.1% | 2.4% |
| Maximum | 21.8% | 38.4% |
| Range | 19.7% | 36.0% |
| Mean | 11.7% | 20.4% |
| Median | 11.2% | 19.6% |
| Interquartile 25% (IQ1) | 10.0% | 17.1% |
| Interquartile 75% (IQ3) | 12.7% | 22.1% |
| Interquartile Range (IQR) | 2.7% | 5.0% |
| Standard Deviation (Sample) | 3.5% | 6.9% |
| Standard Deviation (Population) | 3.5% | 6.8% |
Similar Demographics by Disability
Demographics Similar to Immigrants from Eastern Africa by Disability
In terms of disability, the demographic groups most similar to Immigrants from Eastern Africa are Immigrants from Nicaragua (11.3%, a difference of 0.060%), Immigrants from Uruguay (11.3%, a difference of 0.070%), Immigrants (11.3%, a difference of 0.080%), Immigrants from Kazakhstan (11.3%, a difference of 0.090%), and Immigrants from Greece (11.3%, a difference of 0.11%).
| Demographics | Rating | Rank | Disability |
| Eastern Europeans | 97.8 /100 | #95 | Exceptional 11.2% |
| Immigrants | Zimbabwe | 97.7 /100 | #96 | Exceptional 11.2% |
| Bhutanese | 97.4 /100 | #97 | Exceptional 11.2% |
| Uruguayans | 97.4 /100 | #98 | Exceptional 11.2% |
| Immigrants | Czechoslovakia | 97.4 /100 | #99 | Exceptional 11.2% |
| Immigrants | Greece | 96.9 /100 | #100 | Exceptional 11.3% |
| Immigrants | Nicaragua | 96.8 /100 | #101 | Exceptional 11.3% |
| Immigrants | Eastern Africa | 96.7 /100 | #102 | Exceptional 11.3% |
| Immigrants | Uruguay | 96.4 /100 | #103 | Exceptional 11.3% |
| Immigrants | Immigrants | 96.4 /100 | #104 | Exceptional 11.3% |
| Immigrants | Kazakhstan | 96.4 /100 | #105 | Exceptional 11.3% |
| Immigrants | Eastern Europe | 96.3 /100 | #106 | Exceptional 11.3% |
| Nicaraguans | 96.2 /100 | #107 | Exceptional 11.3% |
| Immigrants | Nigeria | 96.0 /100 | #108 | Exceptional 11.3% |
| Immigrants | Uganda | 95.7 /100 | #109 | Exceptional 11.3% |
Demographics Similar to Colville by Disability
In terms of disability, the demographic groups most similar to Colville are Creek (15.6%, a difference of 1.2%), Kiowa (15.6%, a difference of 1.2%), Lumbee (15.5%, a difference of 1.7%), Puerto Rican (16.1%, a difference of 2.0%), and Tsimshian (16.1%, a difference of 2.2%).
| Demographics | Rating | Rank | Disability |
| Cajuns | 0.0 /100 | #333 | Tragic 14.6% |
| Yuman | 0.0 /100 | #334 | Tragic 14.6% |
| Tohono O'odham | 0.0 /100 | #335 | Tragic 14.8% |
| Cherokee | 0.0 /100 | #336 | Tragic 14.8% |
| Seminole | 0.0 /100 | #337 | Tragic 14.9% |
| Dutch West Indians | 0.0 /100 | #338 | Tragic 14.9% |
| Chickasaw | 0.0 /100 | #339 | Tragic 15.2% |
| Choctaw | 0.0 /100 | #340 | Tragic 15.4% |
| Lumbee | 0.0 /100 | #341 | Tragic 15.5% |
| Kiowa | 0.0 /100 | #342 | Tragic 15.6% |
| Creek | 0.0 /100 | #343 | Tragic 15.6% |
| Colville | 0.0 /100 | #344 | Tragic 15.8% |
| Puerto Ricans | 0.0 /100 | #345 | Tragic 16.1% |
| Tsimshian | 0.0 /100 | #346 | Tragic 16.1% |
| Houma | 0.0 /100 | #347 | Tragic 17.1% |