Immigrants from Dominican Republic vs Hmong Unemployment Among Women with Children Ages 6 to 17 years
COMPARE
Immigrants from Dominican Republic
Hmong
Unemployment Among Women with Children Ages 6 to 17 years
Unemployment Among Women with Children Ages 6 to 17 years Comparison
Immigrants from Dominican Republic
Hmong
10.8%
UNEMPLOYMENT AMONG WOMEN WITH CHILDREN AGES 6 TO 17 YEARS
0.0/ 100
METRIC RATING
324th/ 347
METRIC RANK
8.7%
UNEMPLOYMENT AMONG WOMEN WITH CHILDREN AGES 6 TO 17 YEARS
94.3/ 100
METRIC RATING
128th/ 347
METRIC RANK
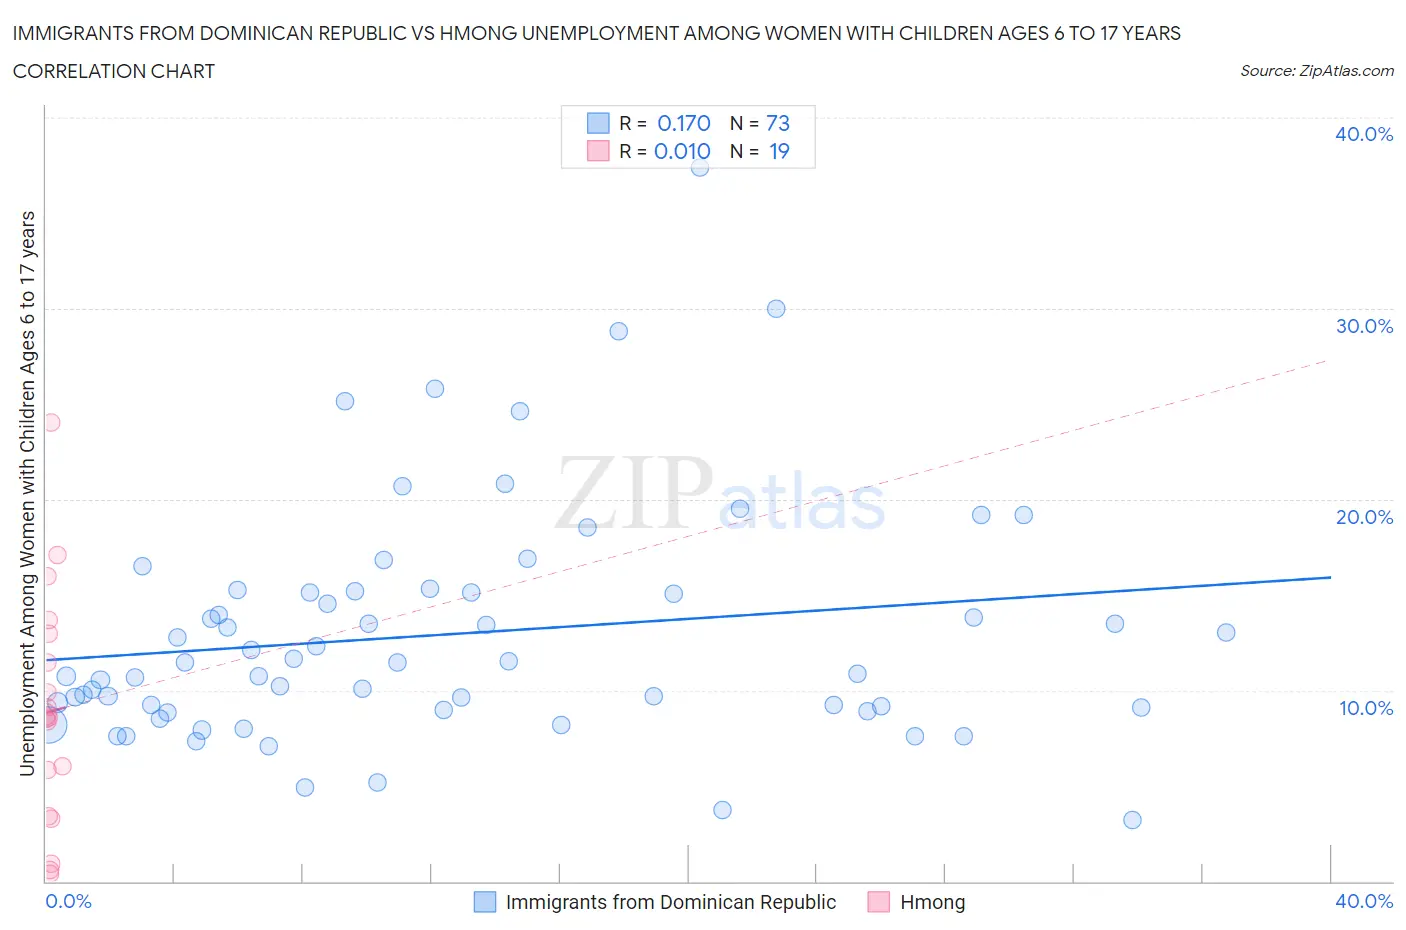
Immigrants from Dominican Republic vs Hmong Unemployment Among Women with Children Ages 6 to 17 years Correlation Chart
The statistical analysis conducted on geographies consisting of 210,922,335 people shows a poor positive correlation between the proportion of Immigrants from Dominican Republic and unemployment rate among women with children between the ages 6 and 17 in the United States with a correlation coefficient (R) of 0.170 and weighted average of 10.8%. Similarly, the statistical analysis conducted on geographies consisting of 23,659,268 people shows no correlation between the proportion of Hmong and unemployment rate among women with children between the ages 6 and 17 in the United States with a correlation coefficient (R) of 0.010 and weighted average of 8.7%, a difference of 24.6%.
Unemployment Among Women with Children Ages 6 to 17 years Correlation Summary
| Measurement | Immigrants from Dominican Republic | Hmong |
| Minimum | 3.2% | 0.40% |
| Maximum | 37.4% | 24.0% |
| Range | 34.2% | 23.6% |
| Mean | 12.9% | 8.9% |
| Median | 11.5% | 8.6% |
| Interquartile 25% (IQ1) | 9.1% | 3.4% |
| Interquartile 75% (IQ3) | 15.2% | 13.0% |
| Interquartile Range (IQR) | 6.1% | 9.6% |
| Standard Deviation (Sample) | 6.2% | 6.1% |
| Standard Deviation (Population) | 6.2% | 6.0% |
Similar Demographics by Unemployment Among Women with Children Ages 6 to 17 years
Demographics Similar to Immigrants from Dominican Republic by Unemployment Among Women with Children Ages 6 to 17 years
In terms of unemployment among women with children ages 6 to 17 years, the demographic groups most similar to Immigrants from Dominican Republic are Dominican (10.8%, a difference of 0.060%), Cree (10.8%, a difference of 0.11%), Cajun (10.8%, a difference of 0.18%), Liberian (10.8%, a difference of 0.25%), and Cape Verdean (10.9%, a difference of 0.32%).
| Demographics | Rating | Rank | Unemployment Among Women with Children Ages 6 to 17 years |
| Bermudans | 0.0 /100 | #317 | Tragic 10.5% |
| Delaware | 0.0 /100 | #318 | Tragic 10.5% |
| Immigrants | Uganda | 0.0 /100 | #319 | Tragic 10.7% |
| Apache | 0.0 /100 | #320 | Tragic 10.7% |
| Tohono O'odham | 0.0 /100 | #321 | Tragic 10.7% |
| Cree | 0.0 /100 | #322 | Tragic 10.8% |
| Dominicans | 0.0 /100 | #323 | Tragic 10.8% |
| Immigrants | Dominican Republic | 0.0 /100 | #324 | Tragic 10.8% |
| Cajuns | 0.0 /100 | #325 | Tragic 10.8% |
| Liberians | 0.0 /100 | #326 | Tragic 10.8% |
| Cape Verdeans | 0.0 /100 | #327 | Tragic 10.9% |
| Ottawa | 0.0 /100 | #328 | Tragic 10.9% |
| Pennsylvania Germans | 0.0 /100 | #329 | Tragic 11.0% |
| Chippewa | 0.0 /100 | #330 | Tragic 11.1% |
| Blacks/African Americans | 0.0 /100 | #331 | Tragic 11.4% |
Demographics Similar to Hmong by Unemployment Among Women with Children Ages 6 to 17 years
In terms of unemployment among women with children ages 6 to 17 years, the demographic groups most similar to Hmong are Czech (8.7%, a difference of 0.020%), Immigrants from Northern Africa (8.7%, a difference of 0.030%), South African (8.7%, a difference of 0.050%), Barbadian (8.7%, a difference of 0.10%), and Immigrants from Morocco (8.7%, a difference of 0.12%).
| Demographics | Rating | Rank | Unemployment Among Women with Children Ages 6 to 17 years |
| Immigrants | Denmark | 95.5 /100 | #121 | Exceptional 8.7% |
| Immigrants | Egypt | 95.0 /100 | #122 | Exceptional 8.7% |
| Immigrants | Morocco | 94.9 /100 | #123 | Exceptional 8.7% |
| Immigrants | Lebanon | 94.9 /100 | #124 | Exceptional 8.7% |
| South Africans | 94.6 /100 | #125 | Exceptional 8.7% |
| Immigrants | Northern Africa | 94.4 /100 | #126 | Exceptional 8.7% |
| Czechs | 94.4 /100 | #127 | Exceptional 8.7% |
| Hmong | 94.3 /100 | #128 | Exceptional 8.7% |
| Barbadians | 93.8 /100 | #129 | Exceptional 8.7% |
| Immigrants | Western Asia | 93.1 /100 | #130 | Exceptional 8.7% |
| Slavs | 92.2 /100 | #131 | Exceptional 8.7% |
| Yaqui | 92.2 /100 | #132 | Exceptional 8.7% |
| Egyptians | 91.8 /100 | #133 | Exceptional 8.7% |
| Immigrants | Ireland | 91.0 /100 | #134 | Exceptional 8.7% |
| Europeans | 90.6 /100 | #135 | Exceptional 8.7% |