Taiwanese vs Hmong Female Disability
COMPARE
Taiwanese
Hmong
Female Disability
Female Disability Comparison
Taiwanese
Hmong
11.4%
FEMALE DISABILITY
99.9/ 100
METRIC RATING
56th/ 347
METRIC RANK
13.1%
FEMALE DISABILITY
0.0/ 100
METRIC RATING
284th/ 347
METRIC RANK
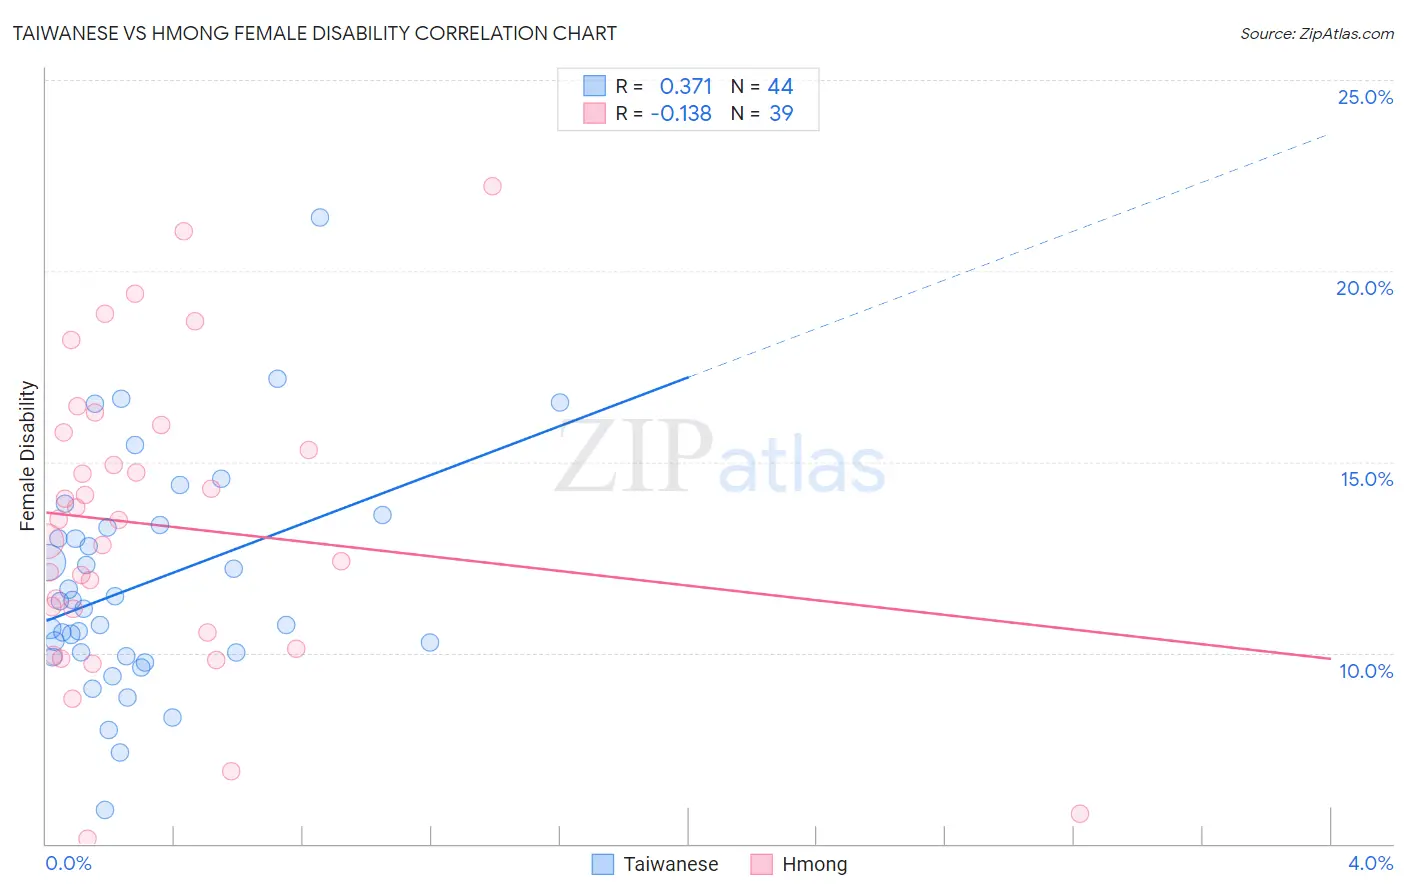
Taiwanese vs Hmong Female Disability Correlation Chart
The statistical analysis conducted on geographies consisting of 31,724,936 people shows a mild positive correlation between the proportion of Taiwanese and percentage of females with a disability in the United States with a correlation coefficient (R) of 0.371 and weighted average of 11.4%. Similarly, the statistical analysis conducted on geographies consisting of 24,681,034 people shows a poor negative correlation between the proportion of Hmong and percentage of females with a disability in the United States with a correlation coefficient (R) of -0.138 and weighted average of 13.1%, a difference of 15.2%.
Female Disability Correlation Summary
| Measurement | Taiwanese | Hmong |
| Minimum | 5.9% | 5.1% |
| Maximum | 21.4% | 22.2% |
| Range | 15.5% | 17.1% |
| Mean | 11.8% | 13.3% |
| Median | 11.2% | 13.5% |
| Interquartile 25% (IQ1) | 10.0% | 10.5% |
| Interquartile 75% (IQ3) | 13.3% | 15.8% |
| Interquartile Range (IQR) | 3.4% | 5.2% |
| Standard Deviation (Sample) | 2.9% | 3.9% |
| Standard Deviation (Population) | 2.9% | 3.8% |
Similar Demographics by Female Disability
Demographics Similar to Taiwanese by Female Disability
In terms of female disability, the demographic groups most similar to Taiwanese are South American (11.4%, a difference of 0.080%), Laotian (11.4%, a difference of 0.090%), Bulgarian (11.3%, a difference of 0.23%), Immigrants from Spain (11.4%, a difference of 0.23%), and Peruvian (11.3%, a difference of 0.25%).
| Demographics | Rating | Rank | Female Disability |
| Tongans | 100.0 /100 | #49 | Exceptional 11.3% |
| Inupiat | 100.0 /100 | #50 | Exceptional 11.3% |
| Immigrants | Belgium | 100.0 /100 | #51 | Exceptional 11.3% |
| Immigrants | Peru | 99.9 /100 | #52 | Exceptional 11.3% |
| Immigrants | Saudi Arabia | 99.9 /100 | #53 | Exceptional 11.3% |
| Peruvians | 99.9 /100 | #54 | Exceptional 11.3% |
| Bulgarians | 99.9 /100 | #55 | Exceptional 11.3% |
| Taiwanese | 99.9 /100 | #56 | Exceptional 11.4% |
| South Americans | 99.9 /100 | #57 | Exceptional 11.4% |
| Laotians | 99.9 /100 | #58 | Exceptional 11.4% |
| Immigrants | Spain | 99.9 /100 | #59 | Exceptional 11.4% |
| Immigrants | Bulgaria | 99.9 /100 | #60 | Exceptional 11.4% |
| Immigrants | France | 99.9 /100 | #61 | Exceptional 11.4% |
| Sri Lankans | 99.9 /100 | #62 | Exceptional 11.4% |
| Immigrants | Colombia | 99.9 /100 | #63 | Exceptional 11.4% |
Demographics Similar to Hmong by Female Disability
In terms of female disability, the demographic groups most similar to Hmong are Bangladeshi (13.1%, a difference of 0.050%), Fijian (13.1%, a difference of 0.10%), English (13.1%, a difference of 0.13%), Welsh (13.1%, a difference of 0.14%), and U.S. Virgin Islander (13.1%, a difference of 0.22%).
| Demographics | Rating | Rank | Female Disability |
| Spanish | 0.1 /100 | #277 | Tragic 13.0% |
| Scottish | 0.1 /100 | #278 | Tragic 13.0% |
| Arapaho | 0.1 /100 | #279 | Tragic 13.0% |
| Irish | 0.1 /100 | #280 | Tragic 13.1% |
| U.S. Virgin Islanders | 0.1 /100 | #281 | Tragic 13.1% |
| Welsh | 0.0 /100 | #282 | Tragic 13.1% |
| English | 0.0 /100 | #283 | Tragic 13.1% |
| Hmong | 0.0 /100 | #284 | Tragic 13.1% |
| Bangladeshis | 0.0 /100 | #285 | Tragic 13.1% |
| Fijians | 0.0 /100 | #286 | Tragic 13.1% |
| Yaqui | 0.0 /100 | #287 | Tragic 13.2% |
| Whites/Caucasians | 0.0 /100 | #288 | Tragic 13.2% |
| Tlingit-Haida | 0.0 /100 | #289 | Tragic 13.2% |
| Immigrants | Yemen | 0.0 /100 | #290 | Tragic 13.2% |
| Shoshone | 0.0 /100 | #291 | Tragic 13.2% |