Immigrants from Dominica vs Moroccan Female Disability
COMPARE
Immigrants from Dominica
Moroccan
Female Disability
Female Disability Comparison
Immigrants from Dominica
Moroccans
13.0%
FEMALE DISABILITY
0.1/ 100
METRIC RATING
276th/ 347
METRIC RANK
12.1%
FEMALE DISABILITY
72.9/ 100
METRIC RATING
156th/ 347
METRIC RANK
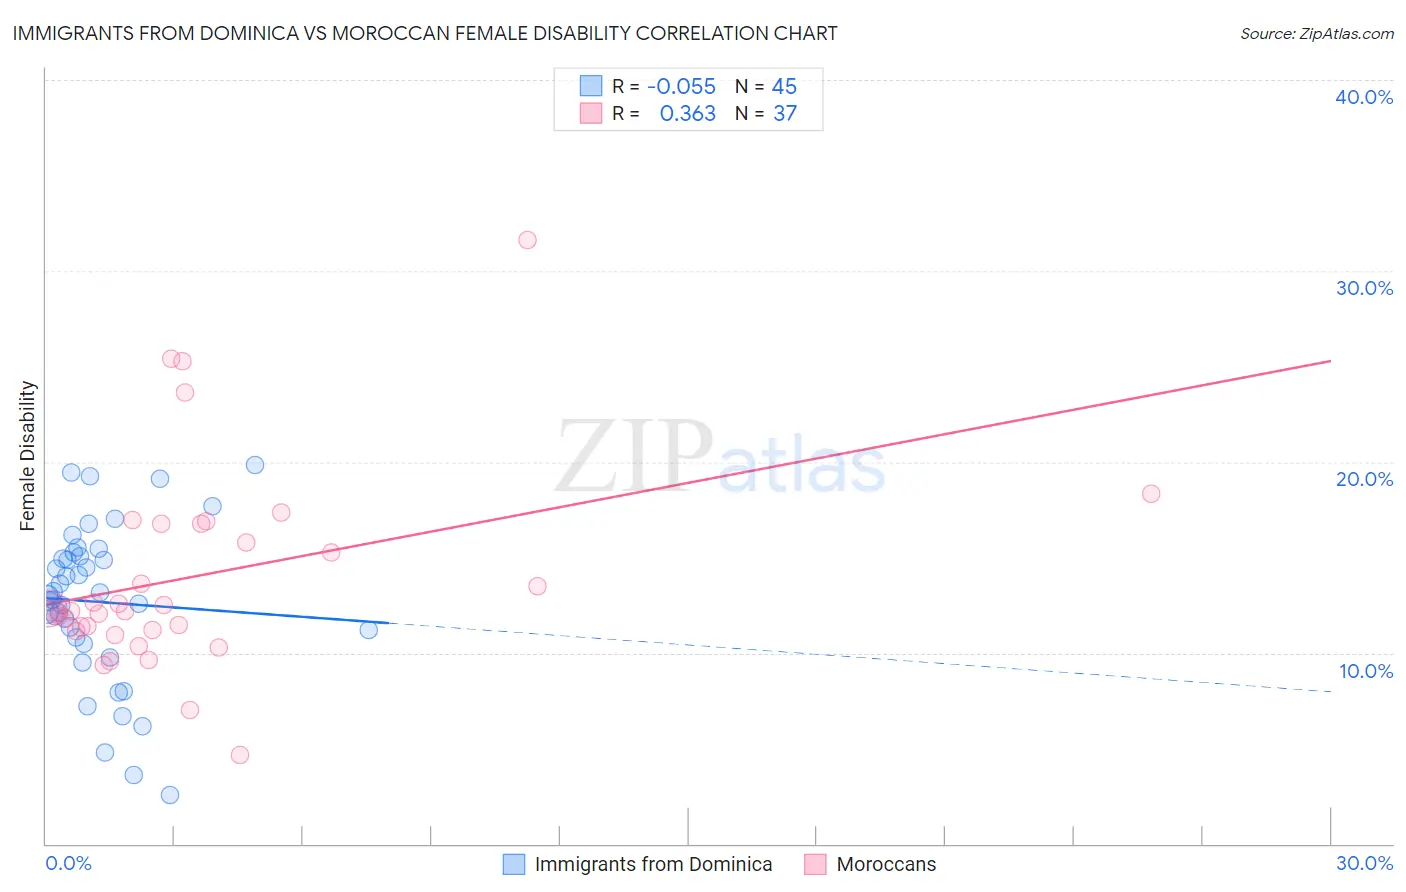
Immigrants from Dominica vs Moroccan Female Disability Correlation Chart
The statistical analysis conducted on geographies consisting of 83,793,109 people shows a slight negative correlation between the proportion of Immigrants from Dominica and percentage of females with a disability in the United States with a correlation coefficient (R) of -0.055 and weighted average of 13.0%. Similarly, the statistical analysis conducted on geographies consisting of 201,802,269 people shows a mild positive correlation between the proportion of Moroccans and percentage of females with a disability in the United States with a correlation coefficient (R) of 0.363 and weighted average of 12.1%, a difference of 7.4%.
Female Disability Correlation Summary
| Measurement | Immigrants from Dominica | Moroccan |
| Minimum | 2.5% | 4.6% |
| Maximum | 19.9% | 31.6% |
| Range | 17.3% | 27.0% |
| Mean | 12.7% | 14.0% |
| Median | 13.0% | 12.2% |
| Interquartile 25% (IQ1) | 10.6% | 11.2% |
| Interquartile 75% (IQ3) | 15.2% | 16.8% |
| Interquartile Range (IQR) | 4.5% | 5.6% |
| Standard Deviation (Sample) | 4.1% | 5.3% |
| Standard Deviation (Population) | 4.1% | 5.3% |
Similar Demographics by Female Disability
Demographics Similar to Immigrants from Dominica by Female Disability
In terms of female disability, the demographic groups most similar to Immigrants from Dominica are Cheyenne (13.0%, a difference of 0.050%), Portuguese (13.0%, a difference of 0.10%), Spanish (13.0%, a difference of 0.20%), Sioux (12.9%, a difference of 0.22%), and German (12.9%, a difference of 0.24%).
| Demographics | Rating | Rank | Female Disability |
| Indonesians | 0.4 /100 | #269 | Tragic 12.8% |
| Immigrants | Liberia | 0.3 /100 | #270 | Tragic 12.9% |
| Dutch | 0.2 /100 | #271 | Tragic 12.9% |
| Germans | 0.1 /100 | #272 | Tragic 12.9% |
| Sioux | 0.1 /100 | #273 | Tragic 12.9% |
| Portuguese | 0.1 /100 | #274 | Tragic 13.0% |
| Cheyenne | 0.1 /100 | #275 | Tragic 13.0% |
| Immigrants | Dominica | 0.1 /100 | #276 | Tragic 13.0% |
| Spanish | 0.1 /100 | #277 | Tragic 13.0% |
| Scottish | 0.1 /100 | #278 | Tragic 13.0% |
| Arapaho | 0.1 /100 | #279 | Tragic 13.0% |
| Irish | 0.1 /100 | #280 | Tragic 13.1% |
| U.S. Virgin Islanders | 0.1 /100 | #281 | Tragic 13.1% |
| Welsh | 0.0 /100 | #282 | Tragic 13.1% |
| English | 0.0 /100 | #283 | Tragic 13.1% |
Demographics Similar to Moroccans by Female Disability
In terms of female disability, the demographic groups most similar to Moroccans are Danish (12.1%, a difference of 0.020%), Immigrants from Middle Africa (12.1%, a difference of 0.020%), Ghanaian (12.1%, a difference of 0.19%), Syrian (12.1%, a difference of 0.20%), and Immigrants from Central America (12.1%, a difference of 0.24%).
| Demographics | Rating | Rank | Female Disability |
| Greeks | 82.0 /100 | #149 | Excellent 12.0% |
| Immigrants | Moldova | 81.4 /100 | #150 | Excellent 12.0% |
| Icelanders | 80.7 /100 | #151 | Excellent 12.0% |
| Immigrants | Scotland | 79.3 /100 | #152 | Good 12.0% |
| Sudanese | 79.1 /100 | #153 | Good 12.0% |
| Syrians | 76.9 /100 | #154 | Good 12.1% |
| Ghanaians | 76.6 /100 | #155 | Good 12.1% |
| Moroccans | 72.9 /100 | #156 | Good 12.1% |
| Danes | 72.5 /100 | #157 | Good 12.1% |
| Immigrants | Middle Africa | 72.4 /100 | #158 | Good 12.1% |
| Immigrants | Central America | 67.7 /100 | #159 | Good 12.1% |
| Immigrants | Guatemala | 66.0 /100 | #160 | Good 12.1% |
| Guyanese | 64.7 /100 | #161 | Good 12.1% |
| Immigrants | Ukraine | 64.3 /100 | #162 | Good 12.1% |
| Guatemalans | 63.8 /100 | #163 | Good 12.1% |