Immigrants from Dominica vs Immigrants from Jamaica Disability Age Over 75
COMPARE
Immigrants from Dominica
Immigrants from Jamaica
Disability Age Over 75
Disability Age Over 75 Comparison
Immigrants from Dominica
Immigrants from Jamaica
49.1%
DISABILITY AGE OVER 75
0.1/ 100
METRIC RATING
275th/ 347
METRIC RANK
47.6%
DISABILITY AGE OVER 75
28.3/ 100
METRIC RATING
192nd/ 347
METRIC RANK
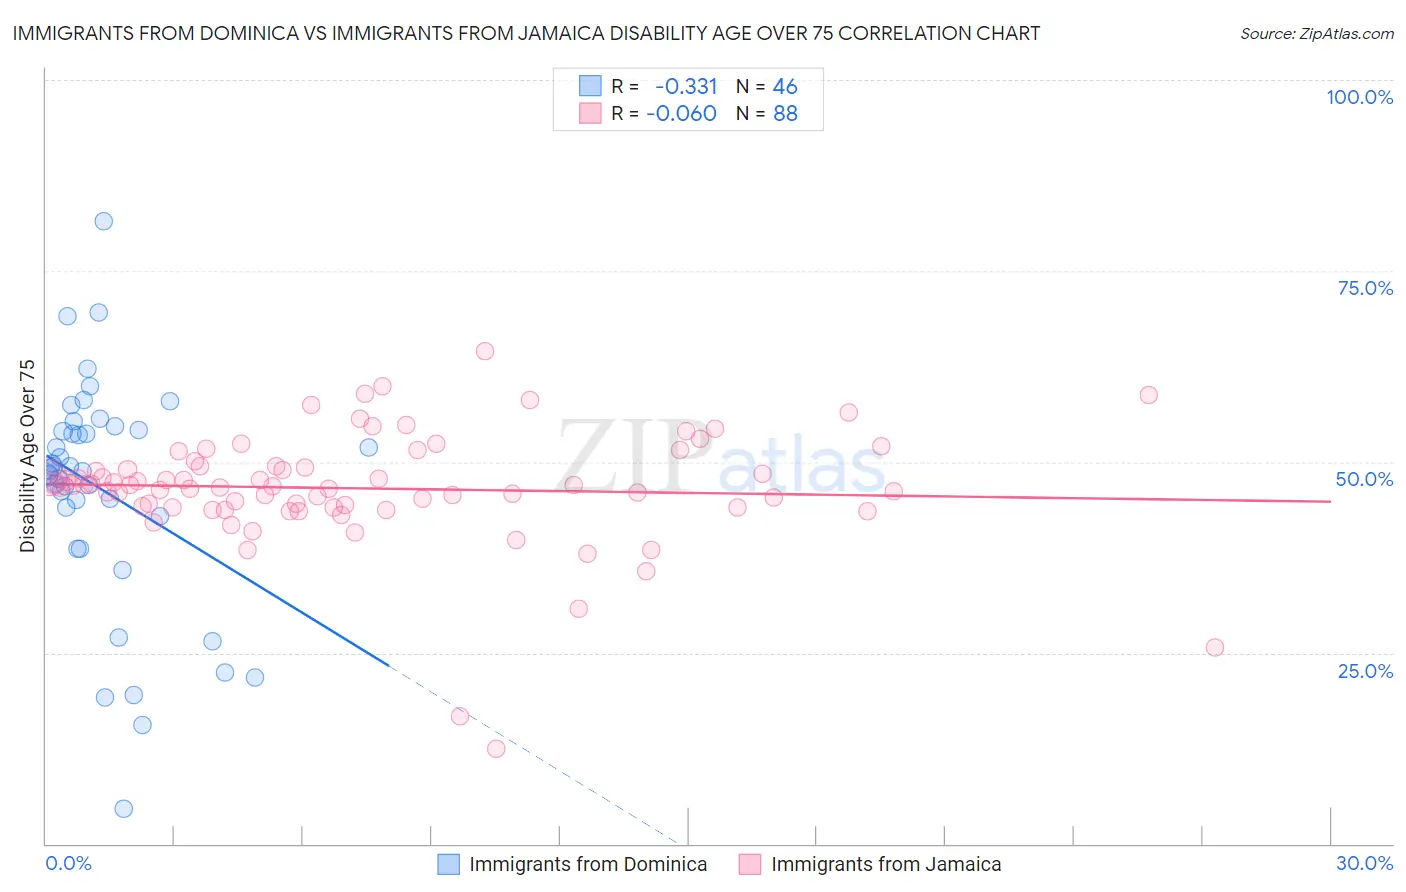
Immigrants from Dominica vs Immigrants from Jamaica Disability Age Over 75 Correlation Chart
The statistical analysis conducted on geographies consisting of 83,692,504 people shows a mild negative correlation between the proportion of Immigrants from Dominica and percentage of population with a disability over the age of 75 in the United States with a correlation coefficient (R) of -0.331 and weighted average of 49.1%. Similarly, the statistical analysis conducted on geographies consisting of 301,075,213 people shows a slight negative correlation between the proportion of Immigrants from Jamaica and percentage of population with a disability over the age of 75 in the United States with a correlation coefficient (R) of -0.060 and weighted average of 47.6%, a difference of 3.2%.
Disability Age Over 75 Correlation Summary
| Measurement | Immigrants from Dominica | Immigrants from Jamaica |
| Minimum | 4.6% | 12.5% |
| Maximum | 81.5% | 64.6% |
| Range | 76.9% | 52.1% |
| Mean | 46.3% | 46.5% |
| Median | 49.0% | 46.9% |
| Interquartile 25% (IQ1) | 42.9% | 44.1% |
| Interquartile 75% (IQ3) | 54.2% | 49.4% |
| Interquartile Range (IQR) | 11.4% | 5.4% |
| Standard Deviation (Sample) | 15.0% | 7.7% |
| Standard Deviation (Population) | 14.8% | 7.6% |
Similar Demographics by Disability Age Over 75
Demographics Similar to Immigrants from Dominica by Disability Age Over 75
In terms of disability age over 75, the demographic groups most similar to Immigrants from Dominica are Immigrants from Guatemala (49.1%, a difference of 0.010%), Immigrants from Iraq (49.1%, a difference of 0.080%), Immigrants from Uzbekistan (49.2%, a difference of 0.12%), Assyrian/Chaldean/Syriac (49.1%, a difference of 0.14%), and Hawaiian (49.2%, a difference of 0.14%).
| Demographics | Rating | Rank | Disability Age Over 75 |
| Guatemalans | 0.2 /100 | #268 | Tragic 49.0% |
| Immigrants | El Salvador | 0.2 /100 | #269 | Tragic 49.0% |
| Potawatomi | 0.2 /100 | #270 | Tragic 49.0% |
| Fijians | 0.2 /100 | #271 | Tragic 49.0% |
| Assyrians/Chaldeans/Syriacs | 0.2 /100 | #272 | Tragic 49.1% |
| Immigrants | Iraq | 0.1 /100 | #273 | Tragic 49.1% |
| Immigrants | Guatemala | 0.1 /100 | #274 | Tragic 49.1% |
| Immigrants | Dominica | 0.1 /100 | #275 | Tragic 49.1% |
| Immigrants | Uzbekistan | 0.1 /100 | #276 | Tragic 49.2% |
| Hawaiians | 0.1 /100 | #277 | Tragic 49.2% |
| Immigrants | Laos | 0.1 /100 | #278 | Tragic 49.2% |
| Guamanians/Chamorros | 0.0 /100 | #279 | Tragic 49.4% |
| Bangladeshis | 0.0 /100 | #280 | Tragic 49.4% |
| Belizeans | 0.0 /100 | #281 | Tragic 49.4% |
| Blacks/African Americans | 0.0 /100 | #282 | Tragic 49.5% |
Demographics Similar to Immigrants from Jamaica by Disability Age Over 75
In terms of disability age over 75, the demographic groups most similar to Immigrants from Jamaica are Ottawa (47.6%, a difference of 0.0%), Somali (47.6%, a difference of 0.030%), Portuguese (47.6%, a difference of 0.030%), Immigrants from Lebanon (47.6%, a difference of 0.050%), and Basque (47.6%, a difference of 0.070%).
| Demographics | Rating | Rank | Disability Age Over 75 |
| Ghanaians | 33.0 /100 | #185 | Fair 47.5% |
| Sudanese | 32.0 /100 | #186 | Fair 47.5% |
| Immigrants | Sudan | 31.8 /100 | #187 | Fair 47.5% |
| Basques | 30.9 /100 | #188 | Fair 47.6% |
| Immigrants | Kenya | 30.8 /100 | #189 | Fair 47.6% |
| Somalis | 29.5 /100 | #190 | Fair 47.6% |
| Portuguese | 29.3 /100 | #191 | Fair 47.6% |
| Immigrants | Jamaica | 28.3 /100 | #192 | Fair 47.6% |
| Ottawa | 28.1 /100 | #193 | Fair 47.6% |
| Immigrants | Lebanon | 26.5 /100 | #194 | Fair 47.6% |
| Immigrants | Trinidad and Tobago | 25.3 /100 | #195 | Fair 47.6% |
| Immigrants | Portugal | 23.8 /100 | #196 | Fair 47.6% |
| Pakistanis | 23.4 /100 | #197 | Fair 47.7% |
| Immigrants | Ukraine | 23.2 /100 | #198 | Fair 47.7% |
| Immigrants | Eritrea | 22.4 /100 | #199 | Fair 47.7% |