Immigrants from Dominica vs Immigrants from Jamaica Householder Income Under 25 years
COMPARE
Immigrants from Dominica
Immigrants from Jamaica
Householder Income Under 25 years
Householder Income Under 25 years Comparison
Immigrants from Dominica
Immigrants from Jamaica
$50,301
HOUSEHOLDER INCOME UNDER 25 YEARS
1.0/ 100
METRIC RATING
259th/ 347
METRIC RANK
$51,038
HOUSEHOLDER INCOME UNDER 25 YEARS
5.6/ 100
METRIC RATING
225th/ 347
METRIC RANK
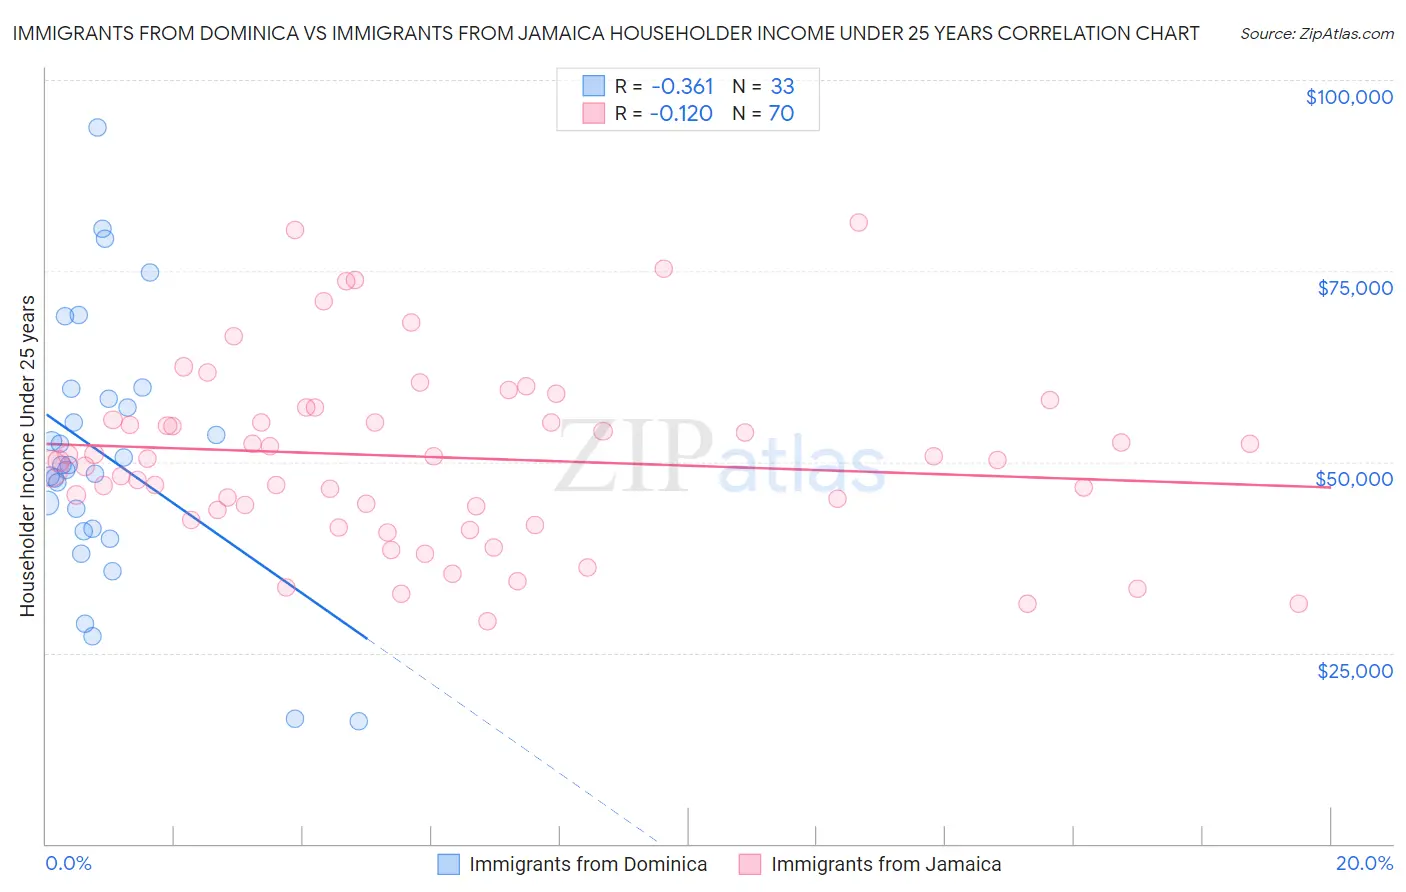
Immigrants from Dominica vs Immigrants from Jamaica Householder Income Under 25 years Correlation Chart
The statistical analysis conducted on geographies consisting of 77,753,008 people shows a mild negative correlation between the proportion of Immigrants from Dominica and household income with householder under the age of 25 in the United States with a correlation coefficient (R) of -0.361 and weighted average of $50,301. Similarly, the statistical analysis conducted on geographies consisting of 257,803,816 people shows a poor negative correlation between the proportion of Immigrants from Jamaica and household income with householder under the age of 25 in the United States with a correlation coefficient (R) of -0.120 and weighted average of $51,038, a difference of 1.5%.
Householder Income Under 25 years Correlation Summary
| Measurement | Immigrants from Dominica | Immigrants from Jamaica |
| Minimum | $16,120 | $29,211 |
| Maximum | $93,750 | $81,354 |
| Range | $77,630 | $52,143 |
| Mean | $50,859 | $50,619 |
| Median | $49,516 | $50,278 |
| Interquartile 25% (IQ1) | $41,058 | $43,769 |
| Interquartile 75% (IQ3) | $58,934 | $55,499 |
| Interquartile Range (IQR) | $17,875 | $11,730 |
| Standard Deviation (Sample) | $17,077 | $11,678 |
| Standard Deviation (Population) | $16,816 | $11,594 |
Similar Demographics by Householder Income Under 25 years
Demographics Similar to Immigrants from Dominica by Householder Income Under 25 years
In terms of householder income under 25 years, the demographic groups most similar to Immigrants from Dominica are Hispanic or Latino ($50,279, a difference of 0.040%), White/Caucasian ($50,336, a difference of 0.070%), Lebanese ($50,355, a difference of 0.11%), Hungarian ($50,247, a difference of 0.11%), and Haitian ($50,231, a difference of 0.14%).
| Demographics | Rating | Rank | Householder Income Under 25 years |
| Immigrants | Mexico | 1.3 /100 | #252 | Tragic $50,422 |
| Immigrants | Haiti | 1.2 /100 | #253 | Tragic $50,398 |
| Luxembourgers | 1.2 /100 | #254 | Tragic $50,379 |
| Aleuts | 1.2 /100 | #255 | Tragic $50,377 |
| Immigrants | Cuba | 1.2 /100 | #256 | Tragic $50,374 |
| Lebanese | 1.1 /100 | #257 | Tragic $50,355 |
| Whites/Caucasians | 1.1 /100 | #258 | Tragic $50,336 |
| Immigrants | Dominica | 1.0 /100 | #259 | Tragic $50,301 |
| Hispanics or Latinos | 0.9 /100 | #260 | Tragic $50,279 |
| Hungarians | 0.9 /100 | #261 | Tragic $50,247 |
| Haitians | 0.8 /100 | #262 | Tragic $50,231 |
| Immigrants | Dominican Republic | 0.8 /100 | #263 | Tragic $50,204 |
| Fijians | 0.6 /100 | #264 | Tragic $50,132 |
| Belgians | 0.6 /100 | #265 | Tragic $50,113 |
| Immigrants | Venezuela | 0.6 /100 | #266 | Tragic $50,109 |
Demographics Similar to Immigrants from Jamaica by Householder Income Under 25 years
In terms of householder income under 25 years, the demographic groups most similar to Immigrants from Jamaica are Yugoslavian ($51,028, a difference of 0.020%), Immigrants from Central America ($51,022, a difference of 0.030%), Belizean ($51,094, a difference of 0.11%), Immigrants from Norway ($50,984, a difference of 0.11%), and Serbian ($51,106, a difference of 0.13%).
| Demographics | Rating | Rank | Householder Income Under 25 years |
| Immigrants | Belize | 8.6 /100 | #218 | Tragic $51,223 |
| Arabs | 8.5 /100 | #219 | Tragic $51,219 |
| Immigrants | Germany | 8.0 /100 | #220 | Tragic $51,190 |
| Immigrants | Eastern Africa | 7.4 /100 | #221 | Tragic $51,158 |
| Spaniards | 6.8 /100 | #222 | Tragic $51,117 |
| Serbians | 6.6 /100 | #223 | Tragic $51,106 |
| Belizeans | 6.4 /100 | #224 | Tragic $51,094 |
| Immigrants | Jamaica | 5.6 /100 | #225 | Tragic $51,038 |
| Yugoslavians | 5.5 /100 | #226 | Tragic $51,028 |
| Immigrants | Central America | 5.4 /100 | #227 | Tragic $51,022 |
| Immigrants | Norway | 5.0 /100 | #228 | Tragic $50,984 |
| Yuman | 4.4 /100 | #229 | Tragic $50,933 |
| Jamaicans | 4.4 /100 | #230 | Tragic $50,929 |
| Ugandans | 4.3 /100 | #231 | Tragic $50,923 |
| Slovenes | 4.0 /100 | #232 | Tragic $50,886 |