Immigrants from Indonesia vs Immigrants from Jamaica Disability Age Over 75
COMPARE
Immigrants from Indonesia
Immigrants from Jamaica
Disability Age Over 75
Disability Age Over 75 Comparison
Immigrants from Indonesia
Immigrants from Jamaica
47.8%
DISABILITY AGE OVER 75
14.2/ 100
METRIC RATING
209th/ 347
METRIC RANK
47.6%
DISABILITY AGE OVER 75
28.3/ 100
METRIC RATING
192nd/ 347
METRIC RANK
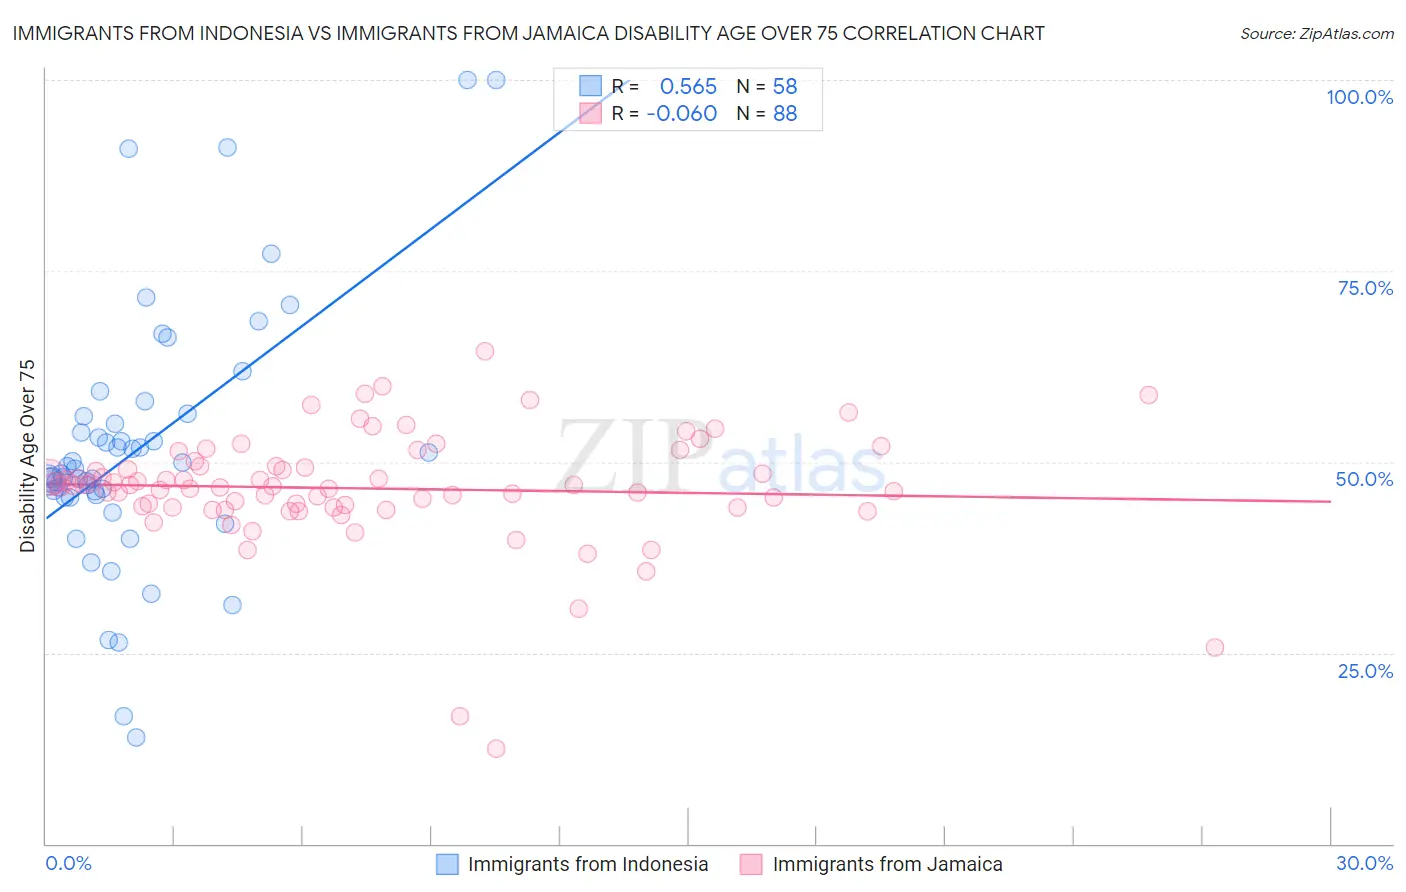
Immigrants from Indonesia vs Immigrants from Jamaica Disability Age Over 75 Correlation Chart
The statistical analysis conducted on geographies consisting of 215,623,970 people shows a substantial positive correlation between the proportion of Immigrants from Indonesia and percentage of population with a disability over the age of 75 in the United States with a correlation coefficient (R) of 0.565 and weighted average of 47.8%. Similarly, the statistical analysis conducted on geographies consisting of 301,075,213 people shows a slight negative correlation between the proportion of Immigrants from Jamaica and percentage of population with a disability over the age of 75 in the United States with a correlation coefficient (R) of -0.060 and weighted average of 47.6%, a difference of 0.48%.
Disability Age Over 75 Correlation Summary
| Measurement | Immigrants from Indonesia | Immigrants from Jamaica |
| Minimum | 13.9% | 12.5% |
| Maximum | 100.0% | 64.6% |
| Range | 86.1% | 52.1% |
| Mean | 51.8% | 46.5% |
| Median | 48.8% | 46.9% |
| Interquartile 25% (IQ1) | 45.7% | 44.1% |
| Interquartile 75% (IQ3) | 56.0% | 49.4% |
| Interquartile Range (IQR) | 10.3% | 5.4% |
| Standard Deviation (Sample) | 16.9% | 7.7% |
| Standard Deviation (Population) | 16.7% | 7.6% |
Demographics Similar to Immigrants from Indonesia and Immigrants from Jamaica by Disability Age Over 75
In terms of disability age over 75, the demographic groups most similar to Immigrants from Indonesia are Immigrants from Senegal (47.8%, a difference of 0.11%), Vietnamese (47.9%, a difference of 0.11%), Immigrants from Syria (47.8%, a difference of 0.13%), Nigerian (47.7%, a difference of 0.20%), and Immigrants from Ghana (47.7%, a difference of 0.20%). Similarly, the demographic groups most similar to Immigrants from Jamaica are Ottawa (47.6%, a difference of 0.0%), Somali (47.6%, a difference of 0.030%), Portuguese (47.6%, a difference of 0.030%), Immigrants from Lebanon (47.6%, a difference of 0.050%), and Immigrants from Trinidad and Tobago (47.6%, a difference of 0.080%).
| Demographics | Rating | Rank | Disability Age Over 75 |
| Somalis | 29.5 /100 | #190 | Fair 47.6% |
| Portuguese | 29.3 /100 | #191 | Fair 47.6% |
| Immigrants | Jamaica | 28.3 /100 | #192 | Fair 47.6% |
| Ottawa | 28.1 /100 | #193 | Fair 47.6% |
| Immigrants | Lebanon | 26.5 /100 | #194 | Fair 47.6% |
| Immigrants | Trinidad and Tobago | 25.3 /100 | #195 | Fair 47.6% |
| Immigrants | Portugal | 23.8 /100 | #196 | Fair 47.6% |
| Pakistanis | 23.4 /100 | #197 | Fair 47.7% |
| Immigrants | Ukraine | 23.2 /100 | #198 | Fair 47.7% |
| Immigrants | Eritrea | 22.4 /100 | #199 | Fair 47.7% |
| Immigrants | Somalia | 21.4 /100 | #200 | Fair 47.7% |
| Immigrants | Cuba | 20.9 /100 | #201 | Fair 47.7% |
| Immigrants | Bahamas | 20.7 /100 | #202 | Fair 47.7% |
| Trinidadians and Tobagonians | 20.0 /100 | #203 | Fair 47.7% |
| Nigerians | 19.2 /100 | #204 | Poor 47.7% |
| Immigrants | Ghana | 19.1 /100 | #205 | Poor 47.7% |
| Jamaicans | 19.0 /100 | #206 | Poor 47.7% |
| Immigrants | Syria | 17.4 /100 | #207 | Poor 47.8% |
| Immigrants | Senegal | 16.9 /100 | #208 | Poor 47.8% |
| Immigrants | Indonesia | 14.2 /100 | #209 | Poor 47.8% |
| Vietnamese | 11.9 /100 | #210 | Poor 47.9% |