Immigrants from Dominica vs Immigrants from Jamaica Median Earnings
COMPARE
Immigrants from Dominica
Immigrants from Jamaica
Median Earnings
Median Earnings Comparison
Immigrants from Dominica
Immigrants from Jamaica
$42,420
MEDIAN EARNINGS
0.4/ 100
METRIC RATING
273rd/ 347
METRIC RANK
$43,026
MEDIAN EARNINGS
0.8/ 100
METRIC RATING
261st/ 347
METRIC RANK
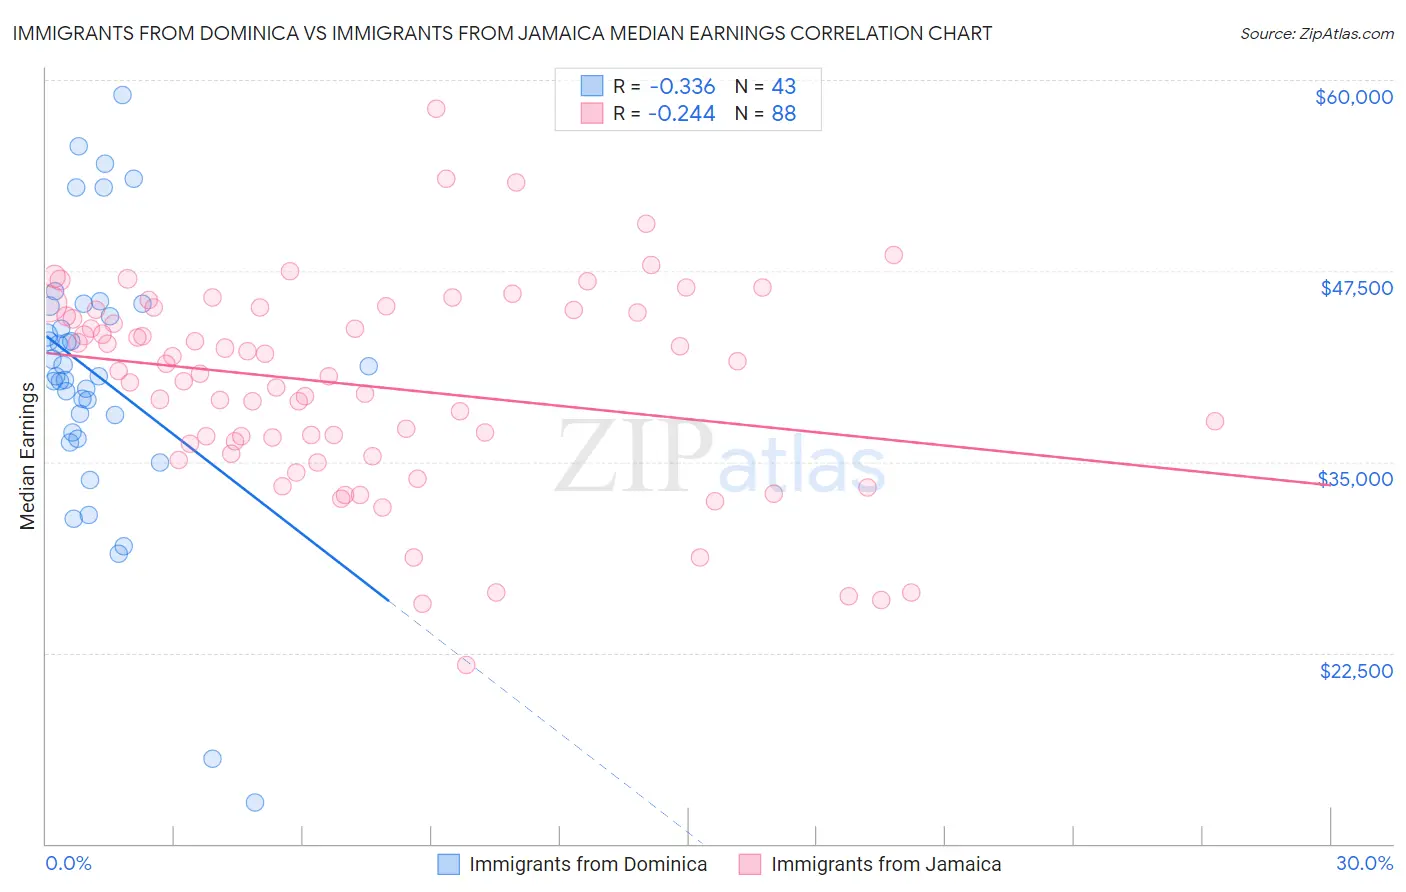
Immigrants from Dominica vs Immigrants from Jamaica Median Earnings Correlation Chart
The statistical analysis conducted on geographies consisting of 83,794,141 people shows a mild negative correlation between the proportion of Immigrants from Dominica and median earnings in the United States with a correlation coefficient (R) of -0.336 and weighted average of $42,420. Similarly, the statistical analysis conducted on geographies consisting of 301,808,266 people shows a weak negative correlation between the proportion of Immigrants from Jamaica and median earnings in the United States with a correlation coefficient (R) of -0.244 and weighted average of $43,026, a difference of 1.4%.
Median Earnings Correlation Summary
| Measurement | Immigrants from Dominica | Immigrants from Jamaica |
| Minimum | $12,717 | $21,741 |
| Maximum | $59,056 | $58,155 |
| Range | $46,339 | $36,414 |
| Mean | $40,644 | $40,000 |
| Median | $40,628 | $40,853 |
| Interquartile 25% (IQ1) | $36,948 | $35,870 |
| Interquartile 75% (IQ3) | $45,188 | $44,978 |
| Interquartile Range (IQR) | $8,240 | $9,108 |
| Standard Deviation (Sample) | $8,982 | $6,782 |
| Standard Deviation (Population) | $8,876 | $6,743 |
Demographics Similar to Immigrants from Dominica and Immigrants from Jamaica by Median Earnings
In terms of median earnings, the demographic groups most similar to Immigrants from Dominica are Immigrants from El Salvador ($42,413, a difference of 0.020%), Iroquois ($42,430, a difference of 0.030%), Immigrants from Belize ($42,339, a difference of 0.19%), Spanish American ($42,316, a difference of 0.25%), and Central American ($42,280, a difference of 0.33%). Similarly, the demographic groups most similar to Immigrants from Jamaica are Nicaraguan ($43,026, a difference of 0.0%), Inupiat ($43,000, a difference of 0.060%), Immigrants from Somalia ($43,100, a difference of 0.17%), Immigrants from Liberia ($42,923, a difference of 0.24%), and Salvadoran ($42,912, a difference of 0.27%).
| Demographics | Rating | Rank | Median Earnings |
| Jamaicans | 1.3 /100 | #257 | Tragic $43,343 |
| French American Indians | 1.3 /100 | #258 | Tragic $43,333 |
| German Russians | 1.1 /100 | #259 | Tragic $43,200 |
| Immigrants | Somalia | 0.9 /100 | #260 | Tragic $43,100 |
| Immigrants | Jamaica | 0.8 /100 | #261 | Tragic $43,026 |
| Nicaraguans | 0.8 /100 | #262 | Tragic $43,026 |
| Inupiat | 0.8 /100 | #263 | Tragic $43,000 |
| Immigrants | Liberia | 0.7 /100 | #264 | Tragic $42,923 |
| Salvadorans | 0.7 /100 | #265 | Tragic $42,912 |
| Immigrants | Laos | 0.7 /100 | #266 | Tragic $42,884 |
| Cree | 0.6 /100 | #267 | Tragic $42,777 |
| Americans | 0.6 /100 | #268 | Tragic $42,742 |
| Belizeans | 0.5 /100 | #269 | Tragic $42,702 |
| Osage | 0.5 /100 | #270 | Tragic $42,651 |
| Pennsylvania Germans | 0.5 /100 | #271 | Tragic $42,615 |
| Iroquois | 0.4 /100 | #272 | Tragic $42,430 |
| Immigrants | Dominica | 0.4 /100 | #273 | Tragic $42,420 |
| Immigrants | El Salvador | 0.4 /100 | #274 | Tragic $42,413 |
| Immigrants | Belize | 0.3 /100 | #275 | Tragic $42,339 |
| Spanish Americans | 0.3 /100 | #276 | Tragic $42,316 |
| Central Americans | 0.3 /100 | #277 | Tragic $42,280 |