Immigrants from Dominica vs Immigrants from Ecuador Disability
COMPARE
Immigrants from Dominica
Immigrants from Ecuador
Disability
Disability Comparison
Immigrants from Dominica
Immigrants from Ecuador
12.4%
DISABILITY
0.6/ 100
METRIC RATING
256th/ 347
METRIC RANK
11.2%
DISABILITY
98.0/ 100
METRIC RATING
93rd/ 347
METRIC RANK
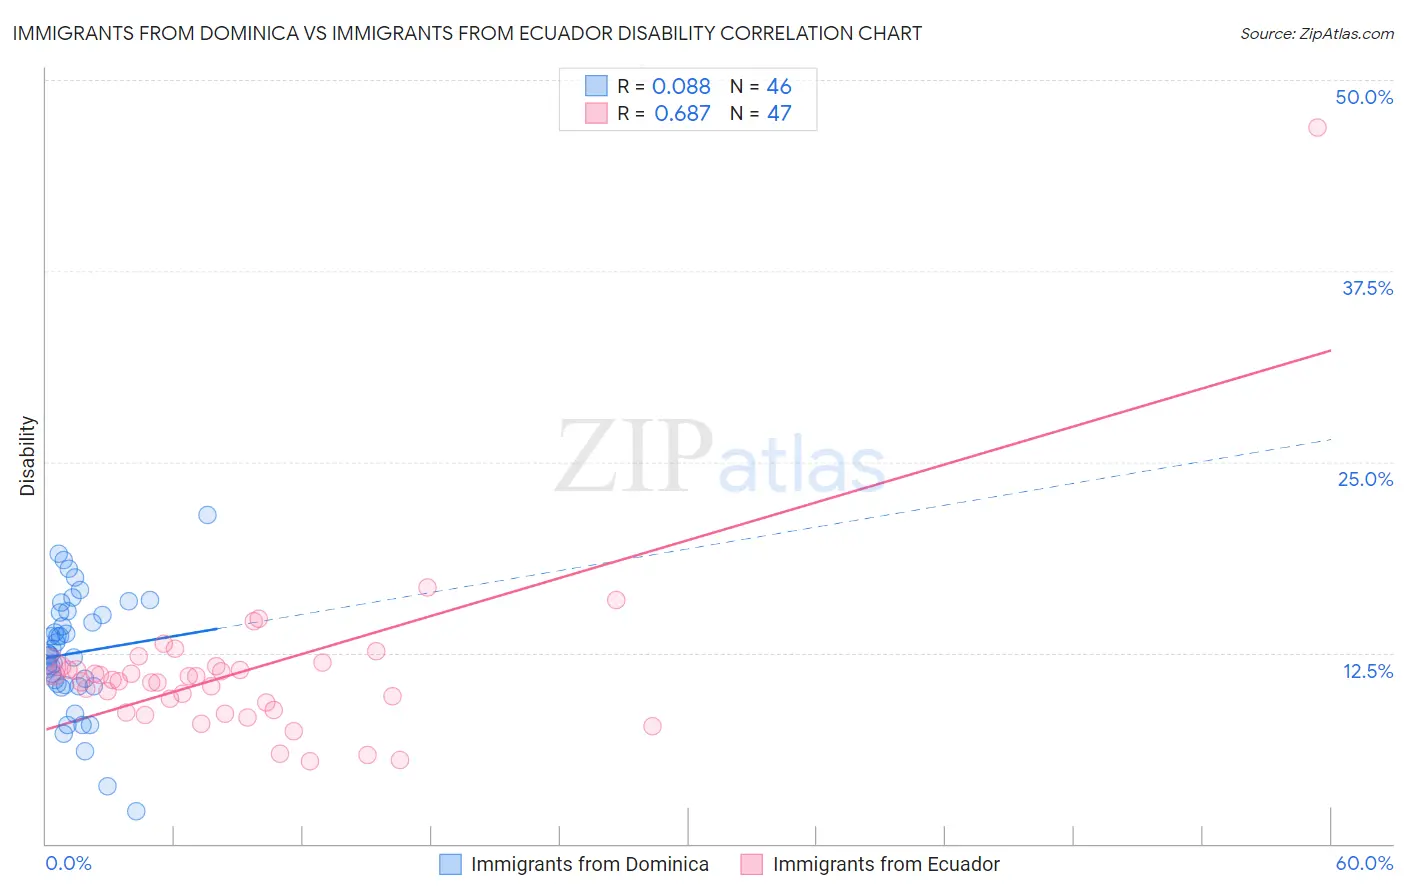
Immigrants from Dominica vs Immigrants from Ecuador Disability Correlation Chart
The statistical analysis conducted on geographies consisting of 83,793,635 people shows a slight positive correlation between the proportion of Immigrants from Dominica and percentage of population with a disability in the United States with a correlation coefficient (R) of 0.088 and weighted average of 12.4%. Similarly, the statistical analysis conducted on geographies consisting of 270,984,648 people shows a significant positive correlation between the proportion of Immigrants from Ecuador and percentage of population with a disability in the United States with a correlation coefficient (R) of 0.687 and weighted average of 11.2%, a difference of 10.5%.
Disability Correlation Summary
| Measurement | Immigrants from Dominica | Immigrants from Ecuador |
| Minimum | 2.1% | 5.4% |
| Maximum | 21.5% | 46.9% |
| Range | 19.4% | 41.5% |
| Mean | 12.5% | 11.2% |
| Median | 12.4% | 10.8% |
| Interquartile 25% (IQ1) | 10.4% | 8.7% |
| Interquartile 75% (IQ3) | 15.1% | 11.7% |
| Interquartile Range (IQR) | 4.7% | 2.9% |
| Standard Deviation (Sample) | 3.9% | 5.8% |
| Standard Deviation (Population) | 3.9% | 5.8% |
Similar Demographics by Disability
Demographics Similar to Immigrants from Dominica by Disability
In terms of disability, the demographic groups most similar to Immigrants from Dominica are Slovene (12.4%, a difference of 0.070%), Immigrants from Laos (12.4%, a difference of 0.090%), Slavic (12.4%, a difference of 0.23%), Canadian (12.4%, a difference of 0.29%), and Immigrants from Liberia (12.4%, a difference of 0.32%).
| Demographics | Rating | Rank | Disability |
| Carpatho Rusyns | 1.4 /100 | #249 | Tragic 12.3% |
| Sub-Saharan Africans | 1.4 /100 | #250 | Tragic 12.3% |
| Europeans | 1.4 /100 | #251 | Tragic 12.3% |
| Bermudans | 1.1 /100 | #252 | Tragic 12.3% |
| Belgians | 0.8 /100 | #253 | Tragic 12.3% |
| German Russians | 0.8 /100 | #254 | Tragic 12.3% |
| Slovenes | 0.6 /100 | #255 | Tragic 12.4% |
| Immigrants | Dominica | 0.6 /100 | #256 | Tragic 12.4% |
| Immigrants | Laos | 0.5 /100 | #257 | Tragic 12.4% |
| Slavs | 0.5 /100 | #258 | Tragic 12.4% |
| Canadians | 0.4 /100 | #259 | Tragic 12.4% |
| Immigrants | Liberia | 0.4 /100 | #260 | Tragic 12.4% |
| Scandinavians | 0.4 /100 | #261 | Tragic 12.4% |
| Native Hawaiians | 0.3 /100 | #262 | Tragic 12.5% |
| Hawaiians | 0.2 /100 | #263 | Tragic 12.5% |
Demographics Similar to Immigrants from Ecuador by Disability
In terms of disability, the demographic groups most similar to Immigrants from Ecuador are Ecuadorian (11.2%, a difference of 0.0%), Immigrants from Western Asia (11.2%, a difference of 0.040%), Immigrants from Brazil (11.2%, a difference of 0.060%), Immigrants from South Africa (11.2%, a difference of 0.11%), and Immigrants from Morocco (11.2%, a difference of 0.12%).
| Demographics | Rating | Rank | Disability |
| Immigrants | Russia | 98.9 /100 | #86 | Exceptional 11.1% |
| Palestinians | 98.9 /100 | #87 | Exceptional 11.1% |
| Immigrants | Romania | 98.5 /100 | #88 | Exceptional 11.2% |
| Immigrants | South Africa | 98.2 /100 | #89 | Exceptional 11.2% |
| Immigrants | Brazil | 98.1 /100 | #90 | Exceptional 11.2% |
| Immigrants | Western Asia | 98.1 /100 | #91 | Exceptional 11.2% |
| Ecuadorians | 98.0 /100 | #92 | Exceptional 11.2% |
| Immigrants | Ecuador | 98.0 /100 | #93 | Exceptional 11.2% |
| Immigrants | Morocco | 97.8 /100 | #94 | Exceptional 11.2% |
| Eastern Europeans | 97.8 /100 | #95 | Exceptional 11.2% |
| Immigrants | Zimbabwe | 97.7 /100 | #96 | Exceptional 11.2% |
| Bhutanese | 97.4 /100 | #97 | Exceptional 11.2% |
| Uruguayans | 97.4 /100 | #98 | Exceptional 11.2% |
| Immigrants | Czechoslovakia | 97.4 /100 | #99 | Exceptional 11.2% |
| Immigrants | Greece | 96.9 /100 | #100 | Exceptional 11.3% |