Ghanaian vs Immigrants from Ecuador Disability
COMPARE
Ghanaian
Immigrants from Ecuador
Disability
Disability Comparison
Ghanaians
Immigrants from Ecuador
11.5%
DISABILITY
87.0/ 100
METRIC RATING
139th/ 347
METRIC RANK
11.2%
DISABILITY
98.0/ 100
METRIC RATING
93rd/ 347
METRIC RANK
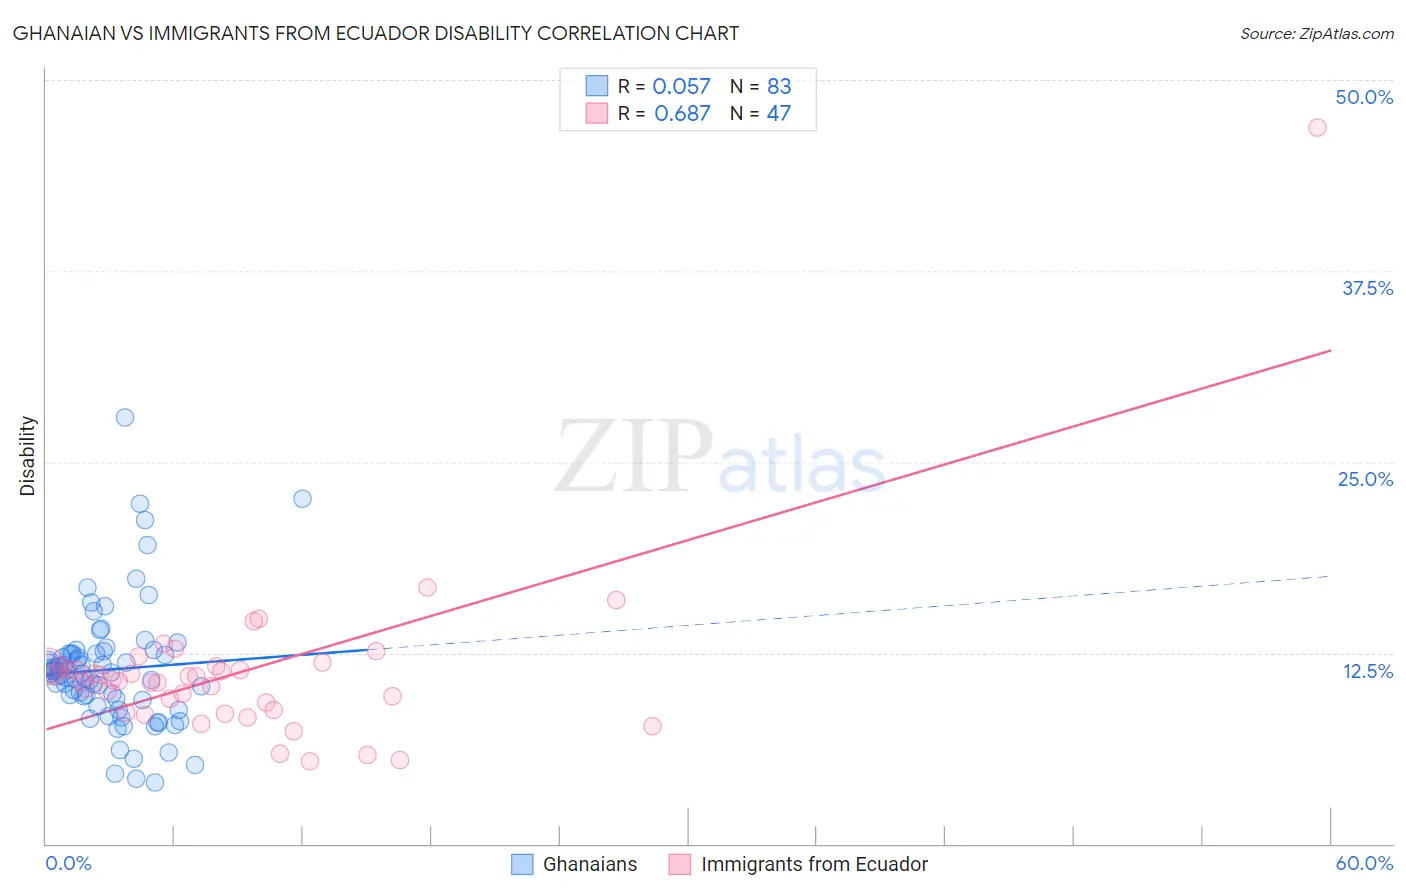
Ghanaian vs Immigrants from Ecuador Disability Correlation Chart
The statistical analysis conducted on geographies consisting of 190,707,236 people shows a slight positive correlation between the proportion of Ghanaians and percentage of population with a disability in the United States with a correlation coefficient (R) of 0.057 and weighted average of 11.5%. Similarly, the statistical analysis conducted on geographies consisting of 270,984,648 people shows a significant positive correlation between the proportion of Immigrants from Ecuador and percentage of population with a disability in the United States with a correlation coefficient (R) of 0.687 and weighted average of 11.2%, a difference of 2.3%.
Disability Correlation Summary
| Measurement | Ghanaian | Immigrants from Ecuador |
| Minimum | 4.0% | 5.4% |
| Maximum | 27.9% | 46.9% |
| Range | 23.8% | 41.5% |
| Mean | 11.4% | 11.2% |
| Median | 11.2% | 10.8% |
| Interquartile 25% (IQ1) | 9.4% | 8.7% |
| Interquartile 75% (IQ3) | 12.5% | 11.7% |
| Interquartile Range (IQR) | 3.0% | 2.9% |
| Standard Deviation (Sample) | 4.0% | 5.8% |
| Standard Deviation (Population) | 4.0% | 5.8% |
Similar Demographics by Disability
Demographics Similar to Ghanaians by Disability
In terms of disability, the demographic groups most similar to Ghanaians are New Zealander (11.5%, a difference of 0.0%), Kenyan (11.5%, a difference of 0.010%), Russian (11.5%, a difference of 0.020%), Immigrants from St. Vincent and the Grenadines (11.4%, a difference of 0.080%), and Immigrants from Grenada (11.5%, a difference of 0.080%).
| Demographics | Rating | Rank | Disability |
| Immigrants | Africa | 89.3 /100 | #132 | Excellent 11.4% |
| Arabs | 89.1 /100 | #133 | Excellent 11.4% |
| Immigrants | Guyana | 88.3 /100 | #134 | Excellent 11.4% |
| Ugandans | 87.9 /100 | #135 | Excellent 11.4% |
| Immigrants | St. Vincent and the Grenadines | 87.8 /100 | #136 | Excellent 11.4% |
| Kenyans | 87.1 /100 | #137 | Excellent 11.5% |
| New Zealanders | 87.0 /100 | #138 | Excellent 11.5% |
| Ghanaians | 87.0 /100 | #139 | Excellent 11.5% |
| Russians | 86.8 /100 | #140 | Excellent 11.5% |
| Immigrants | Grenada | 86.1 /100 | #141 | Excellent 11.5% |
| Immigrants | Sudan | 85.3 /100 | #142 | Excellent 11.5% |
| Moroccans | 83.3 /100 | #143 | Excellent 11.5% |
| Australians | 82.5 /100 | #144 | Excellent 11.5% |
| Nigerians | 81.3 /100 | #145 | Excellent 11.5% |
| Immigrants | Hungary | 79.0 /100 | #146 | Good 11.5% |
Demographics Similar to Immigrants from Ecuador by Disability
In terms of disability, the demographic groups most similar to Immigrants from Ecuador are Ecuadorian (11.2%, a difference of 0.0%), Immigrants from Western Asia (11.2%, a difference of 0.040%), Immigrants from Brazil (11.2%, a difference of 0.060%), Immigrants from South Africa (11.2%, a difference of 0.11%), and Immigrants from Morocco (11.2%, a difference of 0.12%).
| Demographics | Rating | Rank | Disability |
| Immigrants | Russia | 98.9 /100 | #86 | Exceptional 11.1% |
| Palestinians | 98.9 /100 | #87 | Exceptional 11.1% |
| Immigrants | Romania | 98.5 /100 | #88 | Exceptional 11.2% |
| Immigrants | South Africa | 98.2 /100 | #89 | Exceptional 11.2% |
| Immigrants | Brazil | 98.1 /100 | #90 | Exceptional 11.2% |
| Immigrants | Western Asia | 98.1 /100 | #91 | Exceptional 11.2% |
| Ecuadorians | 98.0 /100 | #92 | Exceptional 11.2% |
| Immigrants | Ecuador | 98.0 /100 | #93 | Exceptional 11.2% |
| Immigrants | Morocco | 97.8 /100 | #94 | Exceptional 11.2% |
| Eastern Europeans | 97.8 /100 | #95 | Exceptional 11.2% |
| Immigrants | Zimbabwe | 97.7 /100 | #96 | Exceptional 11.2% |
| Bhutanese | 97.4 /100 | #97 | Exceptional 11.2% |
| Uruguayans | 97.4 /100 | #98 | Exceptional 11.2% |
| Immigrants | Czechoslovakia | 97.4 /100 | #99 | Exceptional 11.2% |
| Immigrants | Greece | 96.9 /100 | #100 | Exceptional 11.3% |