Immigrants from Dominica vs Immigrants from Uruguay Disability
COMPARE
Immigrants from Dominica
Immigrants from Uruguay
Disability
Disability Comparison
Immigrants from Dominica
Immigrants from Uruguay
12.4%
DISABILITY
0.6/ 100
METRIC RATING
256th/ 347
METRIC RANK
11.3%
DISABILITY
96.4/ 100
METRIC RATING
103rd/ 347
METRIC RANK
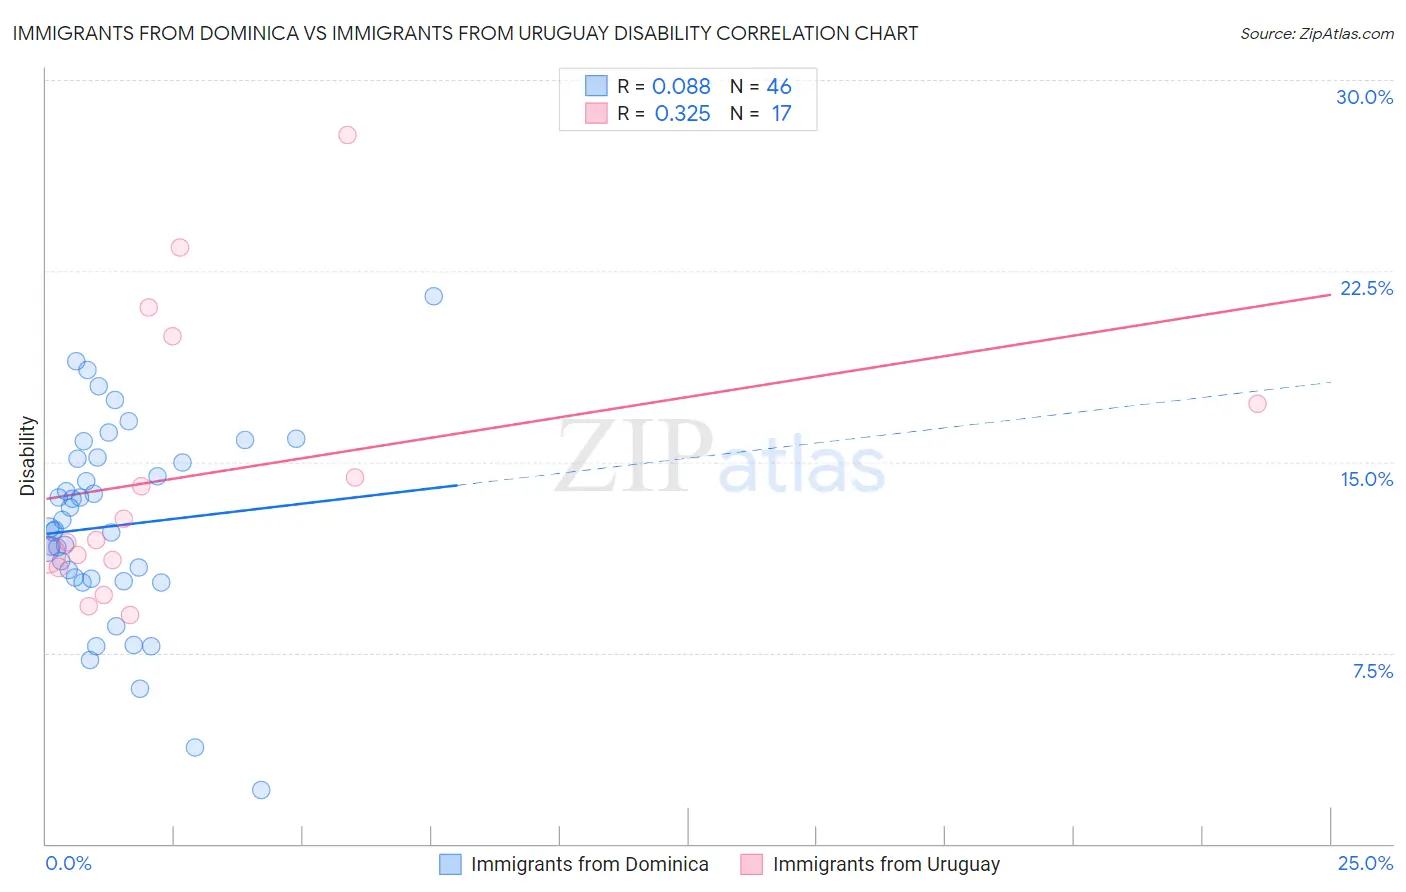
Immigrants from Dominica vs Immigrants from Uruguay Disability Correlation Chart
The statistical analysis conducted on geographies consisting of 83,793,635 people shows a slight positive correlation between the proportion of Immigrants from Dominica and percentage of population with a disability in the United States with a correlation coefficient (R) of 0.088 and weighted average of 12.4%. Similarly, the statistical analysis conducted on geographies consisting of 133,256,548 people shows a mild positive correlation between the proportion of Immigrants from Uruguay and percentage of population with a disability in the United States with a correlation coefficient (R) of 0.325 and weighted average of 11.3%, a difference of 9.7%.
Disability Correlation Summary
| Measurement | Immigrants from Dominica | Immigrants from Uruguay |
| Minimum | 2.1% | 9.0% |
| Maximum | 21.5% | 27.9% |
| Range | 19.4% | 18.8% |
| Mean | 12.5% | 14.5% |
| Median | 12.4% | 12.0% |
| Interquartile 25% (IQ1) | 10.4% | 11.0% |
| Interquartile 75% (IQ3) | 15.1% | 18.6% |
| Interquartile Range (IQR) | 4.7% | 7.6% |
| Standard Deviation (Sample) | 3.9% | 5.5% |
| Standard Deviation (Population) | 3.9% | 5.3% |
Similar Demographics by Disability
Demographics Similar to Immigrants from Dominica by Disability
In terms of disability, the demographic groups most similar to Immigrants from Dominica are Slovene (12.4%, a difference of 0.070%), Immigrants from Laos (12.4%, a difference of 0.090%), Slavic (12.4%, a difference of 0.23%), Canadian (12.4%, a difference of 0.29%), and Immigrants from Liberia (12.4%, a difference of 0.32%).
| Demographics | Rating | Rank | Disability |
| Carpatho Rusyns | 1.4 /100 | #249 | Tragic 12.3% |
| Sub-Saharan Africans | 1.4 /100 | #250 | Tragic 12.3% |
| Europeans | 1.4 /100 | #251 | Tragic 12.3% |
| Bermudans | 1.1 /100 | #252 | Tragic 12.3% |
| Belgians | 0.8 /100 | #253 | Tragic 12.3% |
| German Russians | 0.8 /100 | #254 | Tragic 12.3% |
| Slovenes | 0.6 /100 | #255 | Tragic 12.4% |
| Immigrants | Dominica | 0.6 /100 | #256 | Tragic 12.4% |
| Immigrants | Laos | 0.5 /100 | #257 | Tragic 12.4% |
| Slavs | 0.5 /100 | #258 | Tragic 12.4% |
| Canadians | 0.4 /100 | #259 | Tragic 12.4% |
| Immigrants | Liberia | 0.4 /100 | #260 | Tragic 12.4% |
| Scandinavians | 0.4 /100 | #261 | Tragic 12.4% |
| Native Hawaiians | 0.3 /100 | #262 | Tragic 12.5% |
| Hawaiians | 0.2 /100 | #263 | Tragic 12.5% |
Demographics Similar to Immigrants from Uruguay by Disability
In terms of disability, the demographic groups most similar to Immigrants from Uruguay are Immigrants (11.3%, a difference of 0.010%), Immigrants from Kazakhstan (11.3%, a difference of 0.020%), Immigrants from Eastern Europe (11.3%, a difference of 0.040%), Nicaraguan (11.3%, a difference of 0.060%), and Immigrants from Eastern Africa (11.3%, a difference of 0.070%).
| Demographics | Rating | Rank | Disability |
| Immigrants | Zimbabwe | 97.7 /100 | #96 | Exceptional 11.2% |
| Bhutanese | 97.4 /100 | #97 | Exceptional 11.2% |
| Uruguayans | 97.4 /100 | #98 | Exceptional 11.2% |
| Immigrants | Czechoslovakia | 97.4 /100 | #99 | Exceptional 11.2% |
| Immigrants | Greece | 96.9 /100 | #100 | Exceptional 11.3% |
| Immigrants | Nicaragua | 96.8 /100 | #101 | Exceptional 11.3% |
| Immigrants | Eastern Africa | 96.7 /100 | #102 | Exceptional 11.3% |
| Immigrants | Uruguay | 96.4 /100 | #103 | Exceptional 11.3% |
| Immigrants | Immigrants | 96.4 /100 | #104 | Exceptional 11.3% |
| Immigrants | Kazakhstan | 96.4 /100 | #105 | Exceptional 11.3% |
| Immigrants | Eastern Europe | 96.3 /100 | #106 | Exceptional 11.3% |
| Nicaraguans | 96.2 /100 | #107 | Exceptional 11.3% |
| Immigrants | Nigeria | 96.0 /100 | #108 | Exceptional 11.3% |
| Immigrants | Uganda | 95.7 /100 | #109 | Exceptional 11.3% |
| Immigrants | Denmark | 95.6 /100 | #110 | Exceptional 11.3% |