Immigrants from Denmark vs Barbadian Male Disability
COMPARE
Immigrants from Denmark
Barbadian
Male Disability
Male Disability Comparison
Immigrants from Denmark
Barbadians
11.0%
MALE DISABILITY
76.4/ 100
METRIC RATING
149th/ 347
METRIC RANK
11.2%
MALE DISABILITY
53.4/ 100
METRIC RATING
169th/ 347
METRIC RANK
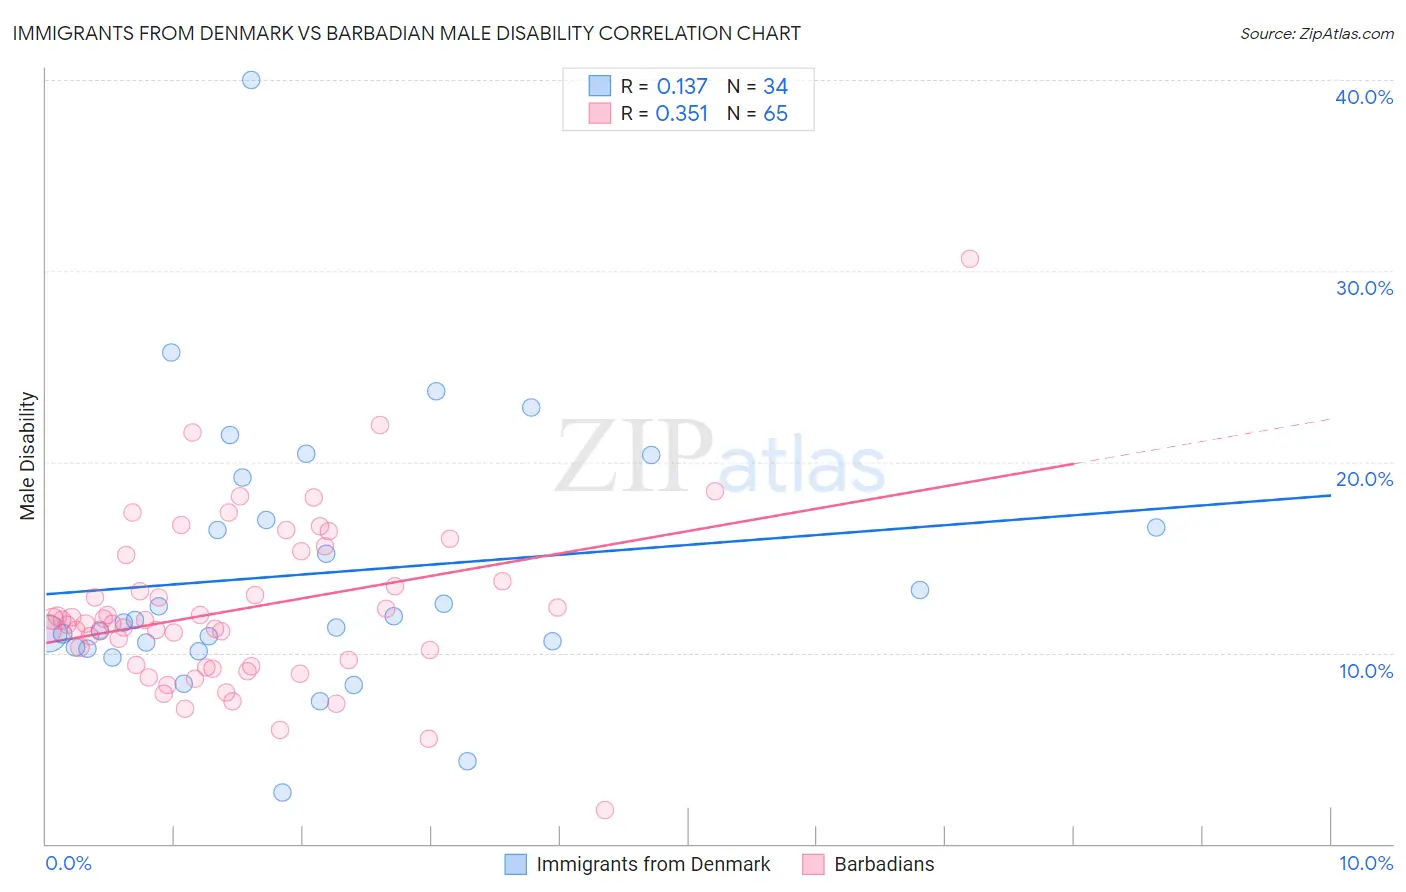
Immigrants from Denmark vs Barbadian Male Disability Correlation Chart
The statistical analysis conducted on geographies consisting of 136,428,328 people shows a poor positive correlation between the proportion of Immigrants from Denmark and percentage of males with a disability in the United States with a correlation coefficient (R) of 0.137 and weighted average of 11.0%. Similarly, the statistical analysis conducted on geographies consisting of 141,288,845 people shows a mild positive correlation between the proportion of Barbadians and percentage of males with a disability in the United States with a correlation coefficient (R) of 0.351 and weighted average of 11.2%, a difference of 1.5%.
Male Disability Correlation Summary
| Measurement | Immigrants from Denmark | Barbadian |
| Minimum | 2.7% | 1.8% |
| Maximum | 40.0% | 30.6% |
| Range | 37.3% | 28.8% |
| Mean | 14.1% | 12.3% |
| Median | 11.7% | 11.6% |
| Interquartile 25% (IQ1) | 10.3% | 9.3% |
| Interquartile 75% (IQ3) | 17.0% | 14.4% |
| Interquartile Range (IQR) | 6.7% | 5.1% |
| Standard Deviation (Sample) | 7.1% | 4.4% |
| Standard Deviation (Population) | 7.0% | 4.4% |
Demographics Similar to Immigrants from Denmark and Barbadians by Male Disability
In terms of male disability, the demographic groups most similar to Immigrants from Denmark are Immigrants from Guatemala (11.0%, a difference of 0.10%), Cuban (11.0%, a difference of 0.12%), Immigrants from Albania (11.0%, a difference of 0.15%), Immigrants from Northern Europe (11.1%, a difference of 0.24%), and Immigrants from Moldova (11.1%, a difference of 0.26%). Similarly, the demographic groups most similar to Barbadians are Immigrants from Latin America (11.2%, a difference of 0.030%), Immigrants from Southern Europe (11.2%, a difference of 0.060%), Immigrants from Hungary (11.1%, a difference of 0.45%), Luxembourger (11.1%, a difference of 0.49%), and British West Indian (11.1%, a difference of 0.54%).
| Demographics | Rating | Rank | Male Disability |
| Immigrants | Denmark | 76.4 /100 | #149 | Good 11.0% |
| Immigrants | Guatemala | 75.1 /100 | #150 | Good 11.0% |
| Cubans | 74.9 /100 | #151 | Good 11.0% |
| Immigrants | Albania | 74.4 /100 | #152 | Good 11.0% |
| Immigrants | Northern Europe | 73.2 /100 | #153 | Good 11.1% |
| Immigrants | Moldova | 72.8 /100 | #154 | Good 11.1% |
| Immigrants | Middle Africa | 70.9 /100 | #155 | Good 11.1% |
| Russians | 69.8 /100 | #156 | Good 11.1% |
| Immigrants | Western Africa | 69.2 /100 | #157 | Good 11.1% |
| Latvians | 68.1 /100 | #158 | Good 11.1% |
| Guatemalans | 67.2 /100 | #159 | Good 11.1% |
| Albanians | 66.5 /100 | #160 | Good 11.1% |
| Immigrants | West Indies | 65.7 /100 | #161 | Good 11.1% |
| Immigrants | Haiti | 65.3 /100 | #162 | Good 11.1% |
| Immigrants | Kenya | 63.8 /100 | #163 | Good 11.1% |
| British West Indians | 62.8 /100 | #164 | Good 11.1% |
| Luxembourgers | 61.9 /100 | #165 | Good 11.1% |
| Immigrants | Hungary | 61.2 /100 | #166 | Good 11.1% |
| Immigrants | Southern Europe | 54.4 /100 | #167 | Average 11.2% |
| Immigrants | Latin America | 54.0 /100 | #168 | Average 11.2% |
| Barbadians | 53.4 /100 | #169 | Average 11.2% |