Immigrants from Denmark vs Immigrants from Brazil Male Disability
COMPARE
Immigrants from Denmark
Immigrants from Brazil
Male Disability
Male Disability Comparison
Immigrants from Denmark
Immigrants from Brazil
11.0%
MALE DISABILITY
76.4/ 100
METRIC RATING
149th/ 347
METRIC RANK
10.8%
MALE DISABILITY
95.0/ 100
METRIC RATING
105th/ 347
METRIC RANK
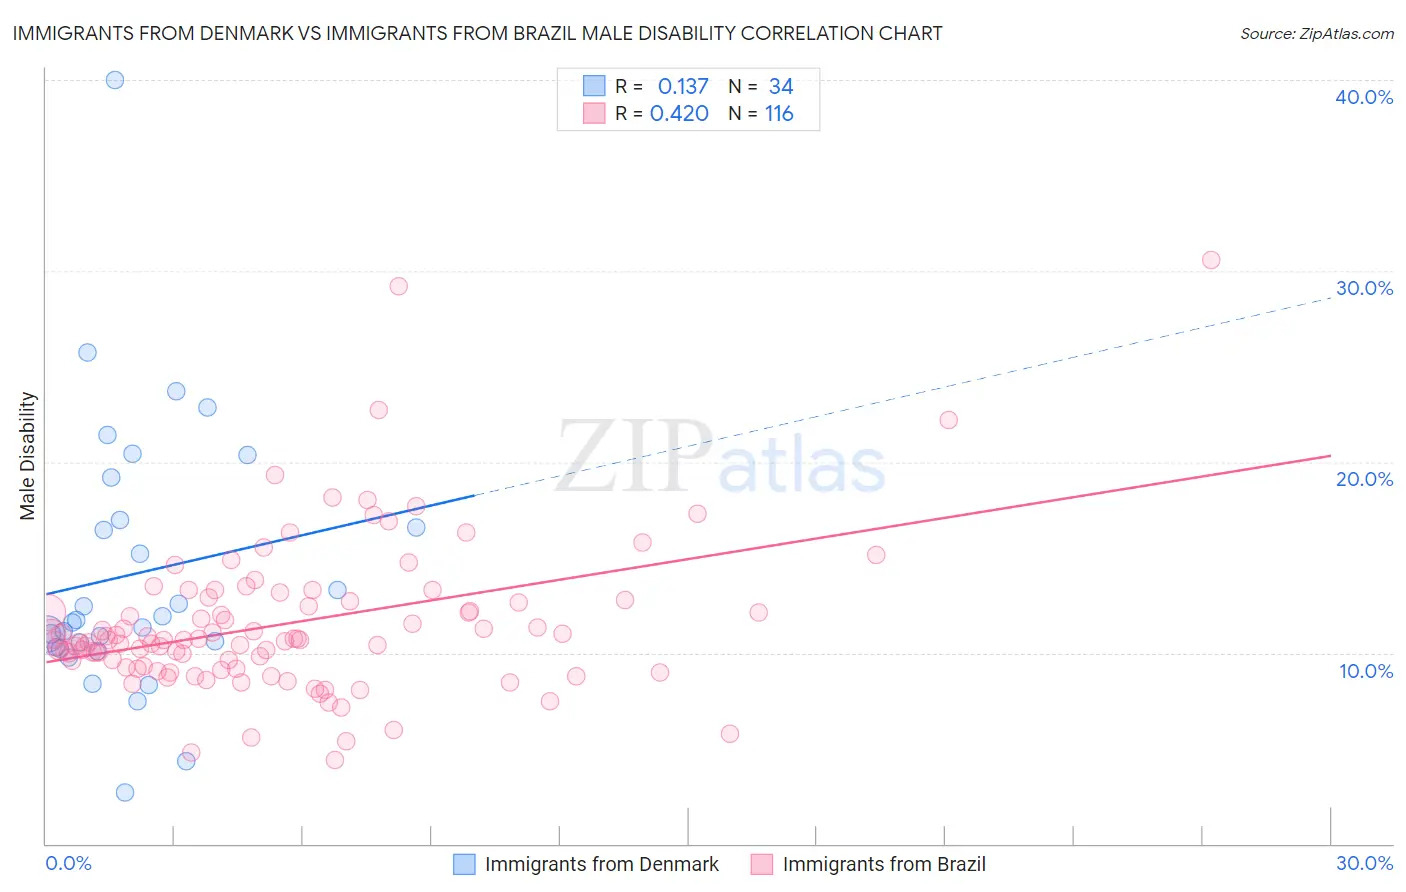
Immigrants from Denmark vs Immigrants from Brazil Male Disability Correlation Chart
The statistical analysis conducted on geographies consisting of 136,428,328 people shows a poor positive correlation between the proportion of Immigrants from Denmark and percentage of males with a disability in the United States with a correlation coefficient (R) of 0.137 and weighted average of 11.0%. Similarly, the statistical analysis conducted on geographies consisting of 342,998,829 people shows a moderate positive correlation between the proportion of Immigrants from Brazil and percentage of males with a disability in the United States with a correlation coefficient (R) of 0.420 and weighted average of 10.8%, a difference of 2.6%.
Male Disability Correlation Summary
| Measurement | Immigrants from Denmark | Immigrants from Brazil |
| Minimum | 2.7% | 4.4% |
| Maximum | 40.0% | 30.6% |
| Range | 37.3% | 26.2% |
| Mean | 14.1% | 11.5% |
| Median | 11.7% | 10.7% |
| Interquartile 25% (IQ1) | 10.3% | 9.3% |
| Interquartile 75% (IQ3) | 17.0% | 12.8% |
| Interquartile Range (IQR) | 6.7% | 3.5% |
| Standard Deviation (Sample) | 7.1% | 4.0% |
| Standard Deviation (Population) | 7.0% | 4.0% |
Similar Demographics by Male Disability
Demographics Similar to Immigrants from Denmark by Male Disability
In terms of male disability, the demographic groups most similar to Immigrants from Denmark are Sudanese (11.0%, a difference of 0.060%), Immigrants from Croatia (11.0%, a difference of 0.070%), Korean (11.0%, a difference of 0.090%), Immigrants from Guatemala (11.0%, a difference of 0.10%), and Cuban (11.0%, a difference of 0.12%).
| Demographics | Rating | Rank | Male Disability |
| Immigrants | Sudan | 81.5 /100 | #142 | Excellent 11.0% |
| Moroccans | 80.7 /100 | #143 | Excellent 11.0% |
| Kenyans | 78.1 /100 | #144 | Good 11.0% |
| Costa Ricans | 78.0 /100 | #145 | Good 11.0% |
| Koreans | 77.5 /100 | #146 | Good 11.0% |
| Immigrants | Croatia | 77.3 /100 | #147 | Good 11.0% |
| Sudanese | 77.1 /100 | #148 | Good 11.0% |
| Immigrants | Denmark | 76.4 /100 | #149 | Good 11.0% |
| Immigrants | Guatemala | 75.1 /100 | #150 | Good 11.0% |
| Cubans | 74.9 /100 | #151 | Good 11.0% |
| Immigrants | Albania | 74.4 /100 | #152 | Good 11.0% |
| Immigrants | Northern Europe | 73.2 /100 | #153 | Good 11.1% |
| Immigrants | Moldova | 72.8 /100 | #154 | Good 11.1% |
| Immigrants | Middle Africa | 70.9 /100 | #155 | Good 11.1% |
| Russians | 69.8 /100 | #156 | Good 11.1% |
Demographics Similar to Immigrants from Brazil by Male Disability
In terms of male disability, the demographic groups most similar to Immigrants from Brazil are Immigrants from Nigeria (10.8%, a difference of 0.010%), Immigrants from Syria (10.8%, a difference of 0.040%), Uruguayan (10.7%, a difference of 0.080%), Immigrants from Eastern Europe (10.7%, a difference of 0.090%), and Immigrants from Greece (10.7%, a difference of 0.19%).
| Demographics | Rating | Rank | Male Disability |
| Immigrants | Romania | 96.5 /100 | #98 | Exceptional 10.7% |
| Immigrants | Switzerland | 96.1 /100 | #99 | Exceptional 10.7% |
| Immigrants | Kazakhstan | 95.9 /100 | #100 | Exceptional 10.7% |
| Immigrants | Greece | 95.6 /100 | #101 | Exceptional 10.7% |
| Immigrants | Eastern Europe | 95.3 /100 | #102 | Exceptional 10.7% |
| Uruguayans | 95.3 /100 | #103 | Exceptional 10.7% |
| Immigrants | Nigeria | 95.1 /100 | #104 | Exceptional 10.8% |
| Immigrants | Brazil | 95.0 /100 | #105 | Exceptional 10.8% |
| Immigrants | Syria | 94.9 /100 | #106 | Exceptional 10.8% |
| Immigrants | Eastern Africa | 94.3 /100 | #107 | Exceptional 10.8% |
| Immigrants | Belgium | 94.2 /100 | #108 | Exceptional 10.8% |
| Immigrants | Uganda | 94.0 /100 | #109 | Exceptional 10.8% |
| Immigrants | Immigrants | 93.9 /100 | #110 | Exceptional 10.8% |
| Immigrants | Uruguay | 93.8 /100 | #111 | Exceptional 10.8% |
| Ghanaians | 93.4 /100 | #112 | Exceptional 10.8% |