Immigrants from Denmark vs Central American Indian Disability Age Under 5
COMPARE
Immigrants from Denmark
Central American Indian
Disability Age Under 5
Disability Age Under 5 Comparison
Immigrants from Denmark
Central American Indians
1.1%
DISABILITY AGE UNDER 5
98.1/ 100
METRIC RATING
77th/ 347
METRIC RANK
1.3%
DISABILITY AGE UNDER 5
3.6/ 100
METRIC RATING
235th/ 347
METRIC RANK
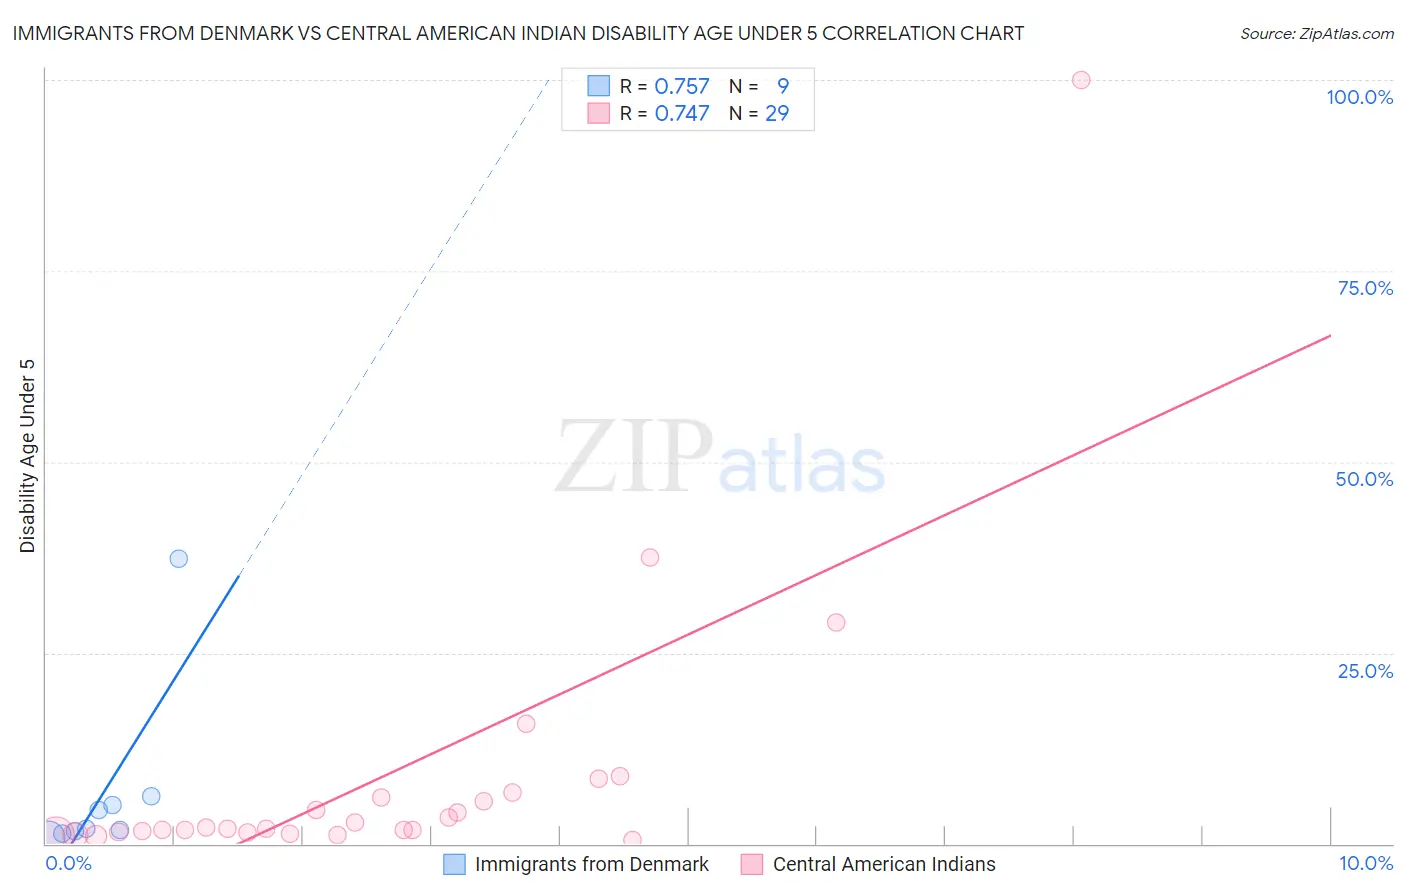
Immigrants from Denmark vs Central American Indian Disability Age Under 5 Correlation Chart
The statistical analysis conducted on geographies consisting of 97,246,779 people shows a strong positive correlation between the proportion of Immigrants from Denmark and percentage of population with a disability under the age of 5 in the United States with a correlation coefficient (R) of 0.757 and weighted average of 1.1%. Similarly, the statistical analysis conducted on geographies consisting of 195,946,772 people shows a strong positive correlation between the proportion of Central American Indians and percentage of population with a disability under the age of 5 in the United States with a correlation coefficient (R) of 0.747 and weighted average of 1.3%, a difference of 17.9%.
Disability Age Under 5 Correlation Summary
| Measurement | Immigrants from Denmark | Central American Indian |
| Minimum | 0.89% | 0.56% |
| Maximum | 37.3% | 100.0% |
| Range | 36.4% | 99.4% |
| Mean | 6.7% | 8.9% |
| Median | 1.9% | 1.9% |
| Interquartile 25% (IQ1) | 1.5% | 1.5% |
| Interquartile 75% (IQ3) | 5.7% | 6.5% |
| Interquartile Range (IQR) | 4.1% | 4.9% |
| Standard Deviation (Sample) | 11.6% | 19.4% |
| Standard Deviation (Population) | 10.9% | 19.1% |
Similar Demographics by Disability Age Under 5
Demographics Similar to Immigrants from Denmark by Disability Age Under 5
In terms of disability age under 5, the demographic groups most similar to Immigrants from Denmark are West Indian (1.1%, a difference of 0.12%), Immigrants from Burma/Myanmar (1.1%, a difference of 0.14%), Hmong (1.1%, a difference of 0.14%), Immigrants from Trinidad and Tobago (1.1%, a difference of 0.16%), and Turkish (1.1%, a difference of 0.18%).
| Demographics | Rating | Rank | Disability Age Under 5 |
| Immigrants | Ecuador | 98.6 /100 | #70 | Exceptional 1.1% |
| Trinidadians and Tobagonians | 98.6 /100 | #71 | Exceptional 1.1% |
| Burmese | 98.5 /100 | #72 | Exceptional 1.1% |
| Immigrants | Sri Lanka | 98.5 /100 | #73 | Exceptional 1.1% |
| Jordanians | 98.5 /100 | #74 | Exceptional 1.1% |
| Immigrants | Pakistan | 98.4 /100 | #75 | Exceptional 1.1% |
| Immigrants | Burma/Myanmar | 98.2 /100 | #76 | Exceptional 1.1% |
| Immigrants | Denmark | 98.1 /100 | #77 | Exceptional 1.1% |
| West Indians | 98.0 /100 | #78 | Exceptional 1.1% |
| Hmong | 98.0 /100 | #79 | Exceptional 1.1% |
| Immigrants | Trinidad and Tobago | 98.0 /100 | #80 | Exceptional 1.1% |
| Turks | 98.0 /100 | #81 | Exceptional 1.1% |
| Immigrants | Jordan | 97.9 /100 | #82 | Exceptional 1.1% |
| Immigrants | Syria | 97.9 /100 | #83 | Exceptional 1.1% |
| Immigrants | Zaire | 97.8 /100 | #84 | Exceptional 1.1% |
Demographics Similar to Central American Indians by Disability Age Under 5
In terms of disability age under 5, the demographic groups most similar to Central American Indians are Pueblo (1.3%, a difference of 0.070%), South American Indian (1.3%, a difference of 0.20%), Tongan (1.3%, a difference of 0.33%), Basque (1.3%, a difference of 0.44%), and French American Indian (1.3%, a difference of 0.45%).
| Demographics | Rating | Rank | Disability Age Under 5 |
| Luxembourgers | 6.1 /100 | #228 | Tragic 1.3% |
| Immigrants | Costa Rica | 5.5 /100 | #229 | Tragic 1.3% |
| Lebanese | 5.3 /100 | #230 | Tragic 1.3% |
| Immigrants | Northern Europe | 4.7 /100 | #231 | Tragic 1.3% |
| French American Indians | 4.5 /100 | #232 | Tragic 1.3% |
| Tongans | 4.2 /100 | #233 | Tragic 1.3% |
| Pueblo | 3.8 /100 | #234 | Tragic 1.3% |
| Central American Indians | 3.6 /100 | #235 | Tragic 1.3% |
| South American Indians | 3.3 /100 | #236 | Tragic 1.3% |
| Basques | 3.0 /100 | #237 | Tragic 1.3% |
| Spanish American Indians | 2.4 /100 | #238 | Tragic 1.3% |
| Immigrants | Austria | 2.3 /100 | #239 | Tragic 1.3% |
| Native Hawaiians | 2.2 /100 | #240 | Tragic 1.3% |
| Maltese | 2.2 /100 | #241 | Tragic 1.3% |
| Lumbee | 2.1 /100 | #242 | Tragic 1.3% |