Immigrants from Czechoslovakia vs Bolivian Vision Disability
COMPARE
Immigrants from Czechoslovakia
Bolivian
Vision Disability
Vision Disability Comparison
Immigrants from Czechoslovakia
Bolivians
2.0%
VISION DISABILITY
98.7/ 100
METRIC RATING
68th/ 347
METRIC RANK
1.9%
VISION DISABILITY
100.0/ 100
METRIC RATING
18th/ 347
METRIC RANK
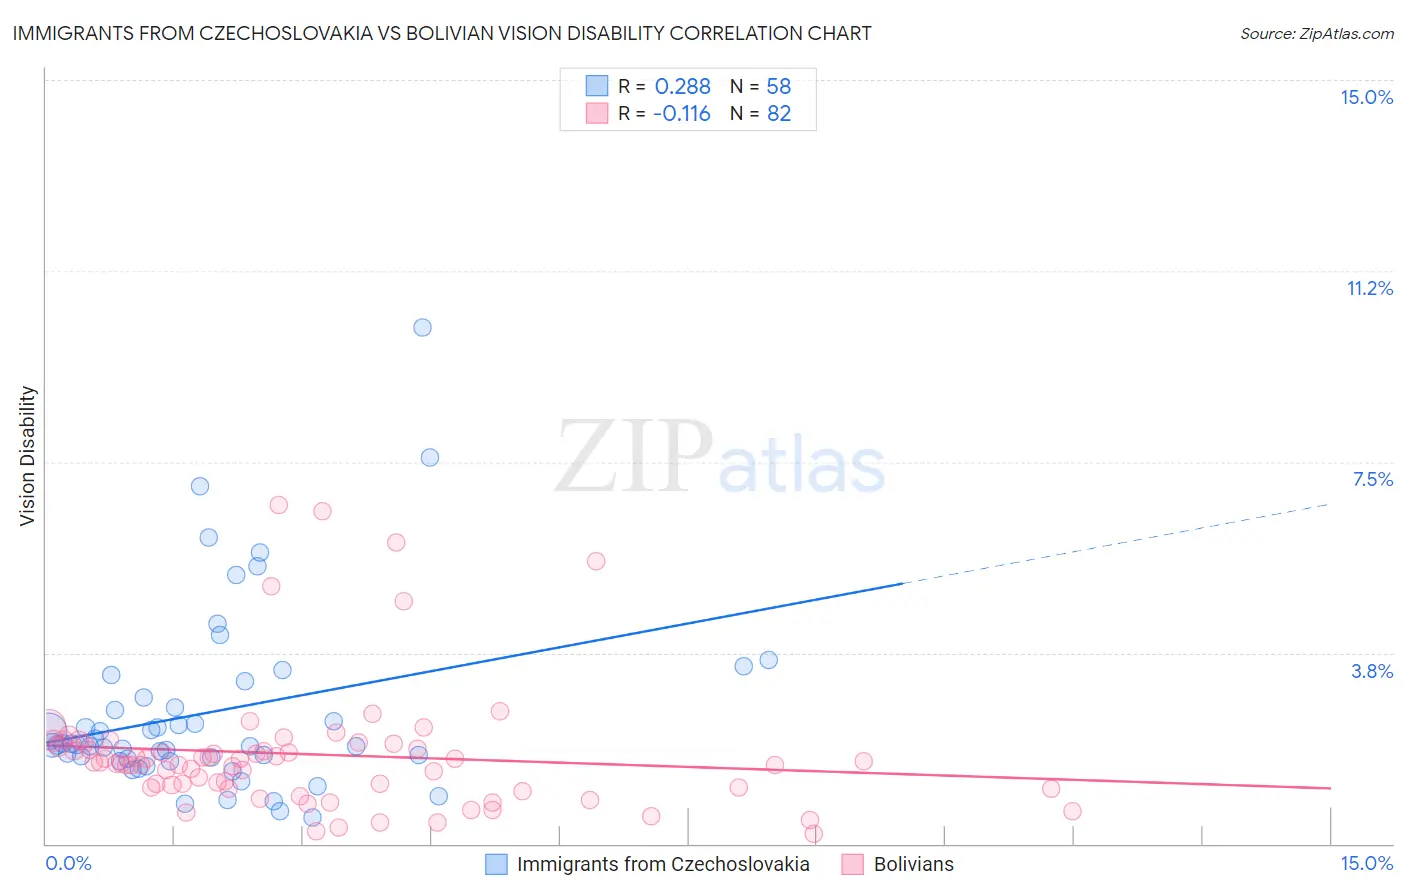
Immigrants from Czechoslovakia vs Bolivian Vision Disability Correlation Chart
The statistical analysis conducted on geographies consisting of 195,413,823 people shows a weak positive correlation between the proportion of Immigrants from Czechoslovakia and percentage of population with vision disability in the United States with a correlation coefficient (R) of 0.288 and weighted average of 2.0%. Similarly, the statistical analysis conducted on geographies consisting of 184,625,860 people shows a poor negative correlation between the proportion of Bolivians and percentage of population with vision disability in the United States with a correlation coefficient (R) of -0.116 and weighted average of 1.9%, a difference of 8.6%.
Vision Disability Correlation Summary
| Measurement | Immigrants from Czechoslovakia | Bolivian |
| Minimum | 0.52% | 0.21% |
| Maximum | 10.1% | 6.7% |
| Range | 9.6% | 6.4% |
| Mean | 2.6% | 1.8% |
| Median | 1.9% | 1.6% |
| Interquartile 25% (IQ1) | 1.7% | 1.1% |
| Interquartile 75% (IQ3) | 2.9% | 2.0% |
| Interquartile Range (IQR) | 1.2% | 0.85% |
| Standard Deviation (Sample) | 1.8% | 1.3% |
| Standard Deviation (Population) | 1.8% | 1.3% |
Similar Demographics by Vision Disability
Demographics Similar to Immigrants from Czechoslovakia by Vision Disability
In terms of vision disability, the demographic groups most similar to Immigrants from Czechoslovakia are Immigrants from Northern Africa (2.0%, a difference of 0.10%), Russian (2.0%, a difference of 0.17%), Immigrants from Kazakhstan (2.0%, a difference of 0.19%), Immigrants from Northern Europe (2.0%, a difference of 0.20%), and Immigrants from Argentina (2.0%, a difference of 0.21%).
| Demographics | Rating | Rank | Vision Disability |
| Immigrants | Belgium | 99.1 /100 | #61 | Exceptional 2.0% |
| Immigrants | Russia | 99.1 /100 | #62 | Exceptional 2.0% |
| Armenians | 99.0 /100 | #63 | Exceptional 2.0% |
| Immigrants | Greece | 99.0 /100 | #64 | Exceptional 2.0% |
| Maltese | 98.9 /100 | #65 | Exceptional 2.0% |
| Immigrants | Argentina | 98.9 /100 | #66 | Exceptional 2.0% |
| Immigrants | Northern Africa | 98.8 /100 | #67 | Exceptional 2.0% |
| Immigrants | Czechoslovakia | 98.7 /100 | #68 | Exceptional 2.0% |
| Russians | 98.6 /100 | #69 | Exceptional 2.0% |
| Immigrants | Kazakhstan | 98.6 /100 | #70 | Exceptional 2.0% |
| Immigrants | Northern Europe | 98.6 /100 | #71 | Exceptional 2.0% |
| Immigrants | France | 98.5 /100 | #72 | Exceptional 2.0% |
| Immigrants | Eritrea | 98.4 /100 | #73 | Exceptional 2.0% |
| Palestinians | 98.3 /100 | #74 | Exceptional 2.0% |
| Immigrants | North Macedonia | 98.3 /100 | #75 | Exceptional 2.0% |
Demographics Similar to Bolivians by Vision Disability
In terms of vision disability, the demographic groups most similar to Bolivians are Indian (Asian) (1.8%, a difference of 0.42%), Burmese (1.8%, a difference of 0.42%), Immigrants from Bolivia (1.8%, a difference of 0.87%), Immigrants from Sri Lanka (1.9%, a difference of 1.2%), and Immigrants from China (1.8%, a difference of 1.3%).
| Demographics | Rating | Rank | Vision Disability |
| Immigrants | Israel | 100.0 /100 | #11 | Exceptional 1.8% |
| Immigrants | Korea | 100.0 /100 | #12 | Exceptional 1.8% |
| Immigrants | Eastern Asia | 100.0 /100 | #13 | Exceptional 1.8% |
| Immigrants | China | 100.0 /100 | #14 | Exceptional 1.8% |
| Immigrants | Bolivia | 100.0 /100 | #15 | Exceptional 1.8% |
| Indians (Asian) | 100.0 /100 | #16 | Exceptional 1.8% |
| Burmese | 100.0 /100 | #17 | Exceptional 1.8% |
| Bolivians | 100.0 /100 | #18 | Exceptional 1.9% |
| Immigrants | Sri Lanka | 100.0 /100 | #19 | Exceptional 1.9% |
| Asians | 100.0 /100 | #20 | Exceptional 1.9% |
| Turks | 100.0 /100 | #21 | Exceptional 1.9% |
| Immigrants | Pakistan | 100.0 /100 | #22 | Exceptional 1.9% |
| Immigrants | Asia | 99.9 /100 | #23 | Exceptional 1.9% |
| Immigrants | Lithuania | 99.9 /100 | #24 | Exceptional 1.9% |
| Bulgarians | 99.9 /100 | #25 | Exceptional 1.9% |