Immigrants from Czechoslovakia vs Immigrants from Serbia Single Father Households
COMPARE
Immigrants from Czechoslovakia
Immigrants from Serbia
Single Father Households
Single Father Households Comparison
Immigrants from Czechoslovakia
Immigrants from Serbia
2.0%
SINGLE FATHER HOUSEHOLDS
99.9/ 100
METRIC RATING
58th/ 347
METRIC RANK
2.0%
SINGLE FATHER HOUSEHOLDS
99.9/ 100
METRIC RATING
49th/ 347
METRIC RANK
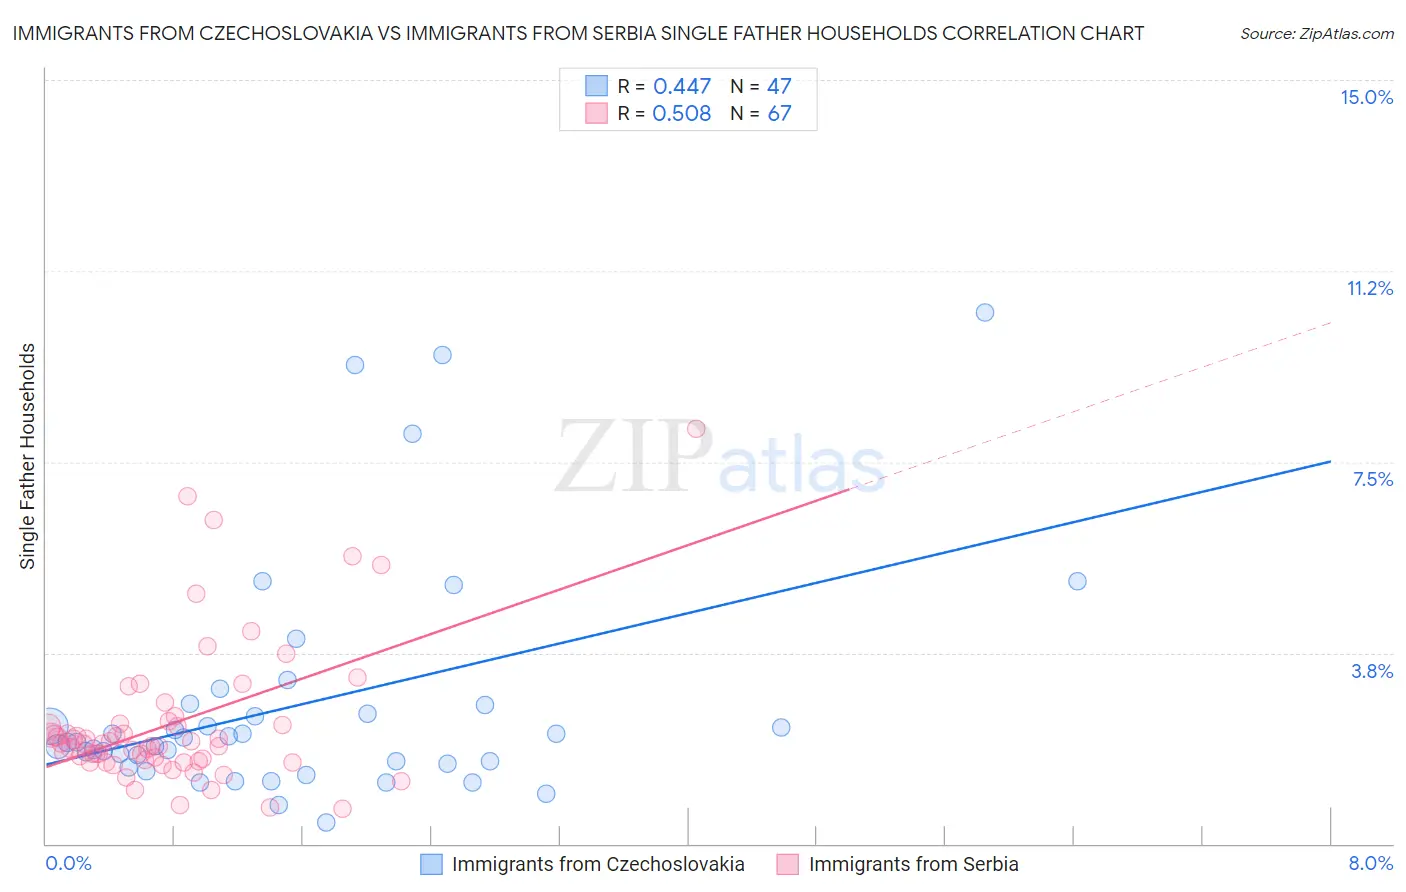
Immigrants from Czechoslovakia vs Immigrants from Serbia Single Father Households Correlation Chart
The statistical analysis conducted on geographies consisting of 194,565,080 people shows a moderate positive correlation between the proportion of Immigrants from Czechoslovakia and percentage of single father households in the United States with a correlation coefficient (R) of 0.447 and weighted average of 2.0%. Similarly, the statistical analysis conducted on geographies consisting of 131,321,851 people shows a substantial positive correlation between the proportion of Immigrants from Serbia and percentage of single father households in the United States with a correlation coefficient (R) of 0.508 and weighted average of 2.0%, a difference of 0.89%.
Single Father Households Correlation Summary
| Measurement | Immigrants from Czechoslovakia | Immigrants from Serbia |
| Minimum | 0.41% | 0.69% |
| Maximum | 10.4% | 8.1% |
| Range | 10.0% | 7.5% |
| Mean | 2.8% | 2.4% |
| Median | 2.0% | 2.0% |
| Interquartile 25% (IQ1) | 1.6% | 1.6% |
| Interquartile 75% (IQ3) | 2.7% | 2.4% |
| Interquartile Range (IQR) | 1.2% | 0.74% |
| Standard Deviation (Sample) | 2.3% | 1.4% |
| Standard Deviation (Population) | 2.3% | 1.4% |
Demographics Similar to Immigrants from Czechoslovakia and Immigrants from Serbia by Single Father Households
In terms of single father households, the demographic groups most similar to Immigrants from Czechoslovakia are Burmese (2.0%, a difference of 0.020%), Immigrants from North Macedonia (2.0%, a difference of 0.11%), Immigrants from Austria (2.0%, a difference of 0.11%), Immigrants from Norway (2.0%, a difference of 0.29%), and Immigrants from France (2.0%, a difference of 0.31%). Similarly, the demographic groups most similar to Immigrants from Serbia are Immigrants from Switzerland (2.0%, a difference of 0.0%), Immigrants from Poland (2.0%, a difference of 0.0%), Immigrants from Kazakhstan (2.0%, a difference of 0.010%), Immigrants from Ukraine (2.0%, a difference of 0.030%), and Immigrants from Europe (2.0%, a difference of 0.25%).
| Demographics | Rating | Rank | Single Father Households |
| Immigrants | Grenada | 100.0 /100 | #43 | Exceptional 2.0% |
| Latvians | 100.0 /100 | #44 | Exceptional 2.0% |
| Russians | 100.0 /100 | #45 | Exceptional 2.0% |
| Immigrants | Lebanon | 100.0 /100 | #46 | Exceptional 2.0% |
| Immigrants | Ukraine | 99.9 /100 | #47 | Exceptional 2.0% |
| Immigrants | Kazakhstan | 99.9 /100 | #48 | Exceptional 2.0% |
| Immigrants | Serbia | 99.9 /100 | #49 | Exceptional 2.0% |
| Immigrants | Switzerland | 99.9 /100 | #50 | Exceptional 2.0% |
| Immigrants | Poland | 99.9 /100 | #51 | Exceptional 2.0% |
| Immigrants | Europe | 99.9 /100 | #52 | Exceptional 2.0% |
| Immigrants | Northern Europe | 99.9 /100 | #53 | Exceptional 2.0% |
| Immigrants | Korea | 99.9 /100 | #54 | Exceptional 2.0% |
| Immigrants | France | 99.9 /100 | #55 | Exceptional 2.0% |
| Immigrants | Norway | 99.9 /100 | #56 | Exceptional 2.0% |
| Burmese | 99.9 /100 | #57 | Exceptional 2.0% |
| Immigrants | Czechoslovakia | 99.9 /100 | #58 | Exceptional 2.0% |
| Immigrants | North Macedonia | 99.9 /100 | #59 | Exceptional 2.0% |
| Immigrants | Austria | 99.9 /100 | #60 | Exceptional 2.0% |
| Vietnamese | 99.9 /100 | #61 | Exceptional 2.0% |
| Immigrants | Malaysia | 99.9 /100 | #62 | Exceptional 2.0% |
| Maltese | 99.9 /100 | #63 | Exceptional 2.0% |