Immigrants from Czechoslovakia vs Immigrants from Serbia 4th Grade
COMPARE
Immigrants from Czechoslovakia
Immigrants from Serbia
4th Grade
4th Grade Comparison
Immigrants from Czechoslovakia
Immigrants from Serbia
97.9%
4TH GRADE
97.5/ 100
METRIC RATING
106th/ 347
METRIC RANK
97.8%
4TH GRADE
92.6/ 100
METRIC RATING
125th/ 347
METRIC RANK
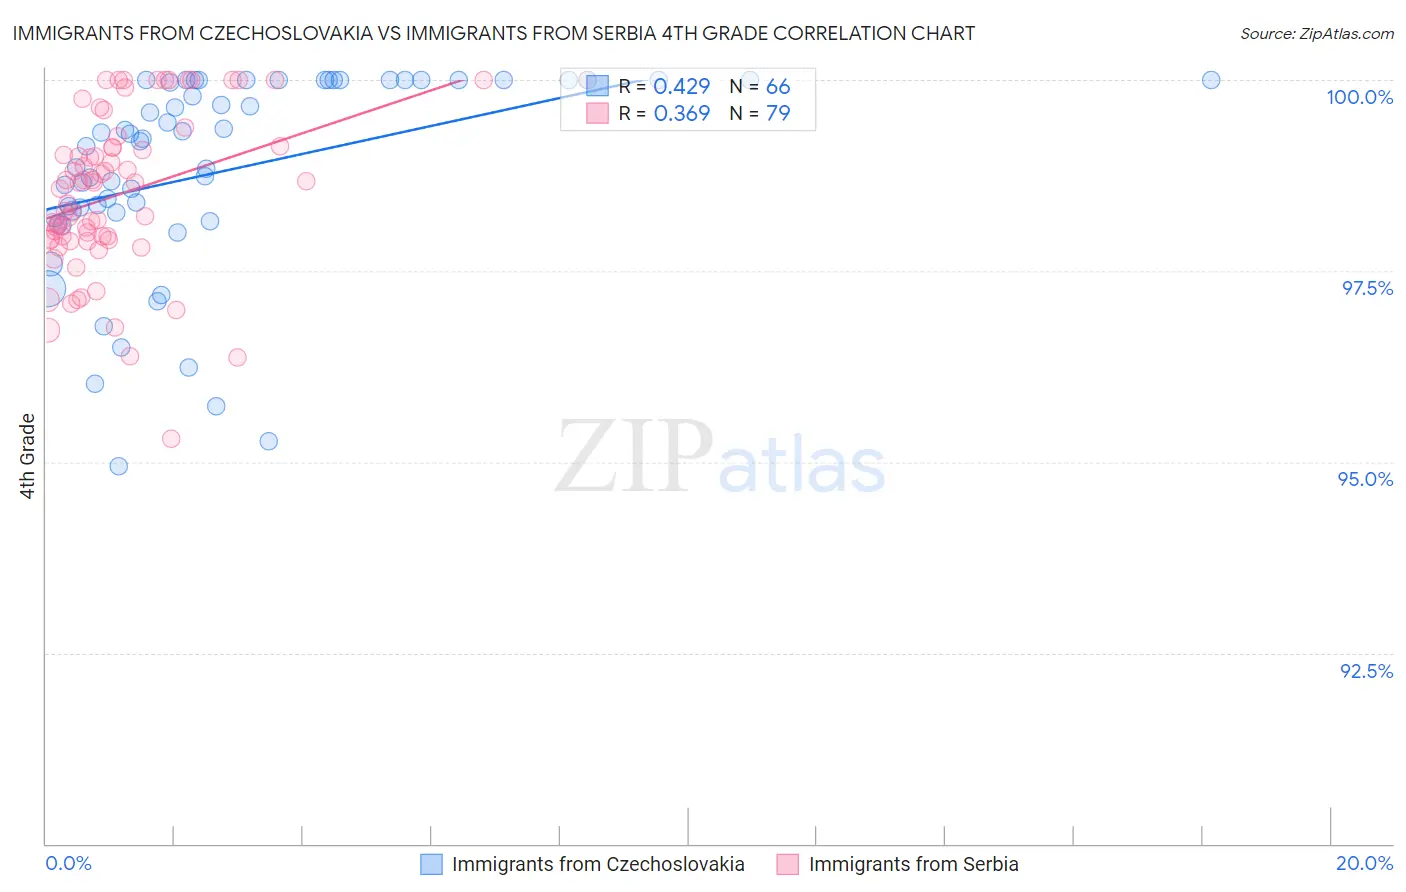
Immigrants from Czechoslovakia vs Immigrants from Serbia 4th Grade Correlation Chart
The statistical analysis conducted on geographies consisting of 195,448,060 people shows a moderate positive correlation between the proportion of Immigrants from Czechoslovakia and percentage of population with at least 4th grade education in the United States with a correlation coefficient (R) of 0.429 and weighted average of 97.9%. Similarly, the statistical analysis conducted on geographies consisting of 131,729,423 people shows a mild positive correlation between the proportion of Immigrants from Serbia and percentage of population with at least 4th grade education in the United States with a correlation coefficient (R) of 0.369 and weighted average of 97.8%, a difference of 0.11%.
4th Grade Correlation Summary
| Measurement | Immigrants from Czechoslovakia | Immigrants from Serbia |
| Minimum | 94.9% | 95.3% |
| Maximum | 100.0% | 100.0% |
| Range | 5.1% | 4.7% |
| Mean | 98.8% | 98.5% |
| Median | 99.2% | 98.7% |
| Interquartile 25% (IQ1) | 98.3% | 97.9% |
| Interquartile 75% (IQ3) | 100.0% | 99.1% |
| Interquartile Range (IQR) | 1.7% | 1.2% |
| Standard Deviation (Sample) | 1.3% | 1.0% |
| Standard Deviation (Population) | 1.3% | 1.0% |
Demographics Similar to Immigrants from Czechoslovakia and Immigrants from Serbia by 4th Grade
In terms of 4th grade, the demographic groups most similar to Immigrants from Czechoslovakia are German Russian (97.9%, a difference of 0.0%), Bhutanese (97.9%, a difference of 0.0%), Immigrants from Singapore (97.9%, a difference of 0.010%), Immigrants from Latvia (97.8%, a difference of 0.020%), and Thai (97.8%, a difference of 0.030%). Similarly, the demographic groups most similar to Immigrants from Serbia are Immigrants from Norway (97.8%, a difference of 0.020%), Immigrants from Japan (97.8%, a difference of 0.020%), Immigrants from Zimbabwe (97.8%, a difference of 0.020%), Spanish (97.8%, a difference of 0.020%), and Immigrants from Saudi Arabia (97.8%, a difference of 0.030%).
| Demographics | Rating | Rank | 4th Grade |
| German Russians | 97.5 /100 | #105 | Exceptional 97.9% |
| Immigrants | Czechoslovakia | 97.5 /100 | #106 | Exceptional 97.9% |
| Bhutanese | 97.4 /100 | #107 | Exceptional 97.9% |
| Immigrants | Singapore | 97.3 /100 | #108 | Exceptional 97.9% |
| Immigrants | Latvia | 96.8 /100 | #109 | Exceptional 97.8% |
| Thais | 96.7 /100 | #110 | Exceptional 97.8% |
| Immigrants | Switzerland | 96.1 /100 | #111 | Exceptional 97.8% |
| Okinawans | 96.0 /100 | #112 | Exceptional 97.8% |
| Basques | 95.8 /100 | #113 | Exceptional 97.8% |
| Iroquois | 95.4 /100 | #114 | Exceptional 97.8% |
| Lebanese | 95.4 /100 | #115 | Exceptional 97.8% |
| Immigrants | Croatia | 95.2 /100 | #116 | Exceptional 97.8% |
| Syrians | 94.9 /100 | #117 | Exceptional 97.8% |
| Menominee | 94.9 /100 | #118 | Exceptional 97.8% |
| Immigrants | Saudi Arabia | 94.8 /100 | #119 | Exceptional 97.8% |
| Immigrants | France | 94.8 /100 | #120 | Exceptional 97.8% |
| Immigrants | Norway | 94.2 /100 | #121 | Exceptional 97.8% |
| Immigrants | Japan | 94.1 /100 | #122 | Exceptional 97.8% |
| Immigrants | Zimbabwe | 93.9 /100 | #123 | Exceptional 97.8% |
| Spanish | 93.7 /100 | #124 | Exceptional 97.8% |
| Immigrants | Serbia | 92.6 /100 | #125 | Exceptional 97.8% |