Immigrants from Czechoslovakia vs Native Hawaiian Hearing Disability
COMPARE
Immigrants from Czechoslovakia
Native Hawaiian
Hearing Disability
Hearing Disability Comparison
Immigrants from Czechoslovakia
Native Hawaiians
3.1%
HEARING DISABILITY
15.9/ 100
METRIC RATING
204th/ 347
METRIC RANK
3.7%
HEARING DISABILITY
0.0/ 100
METRIC RATING
292nd/ 347
METRIC RANK
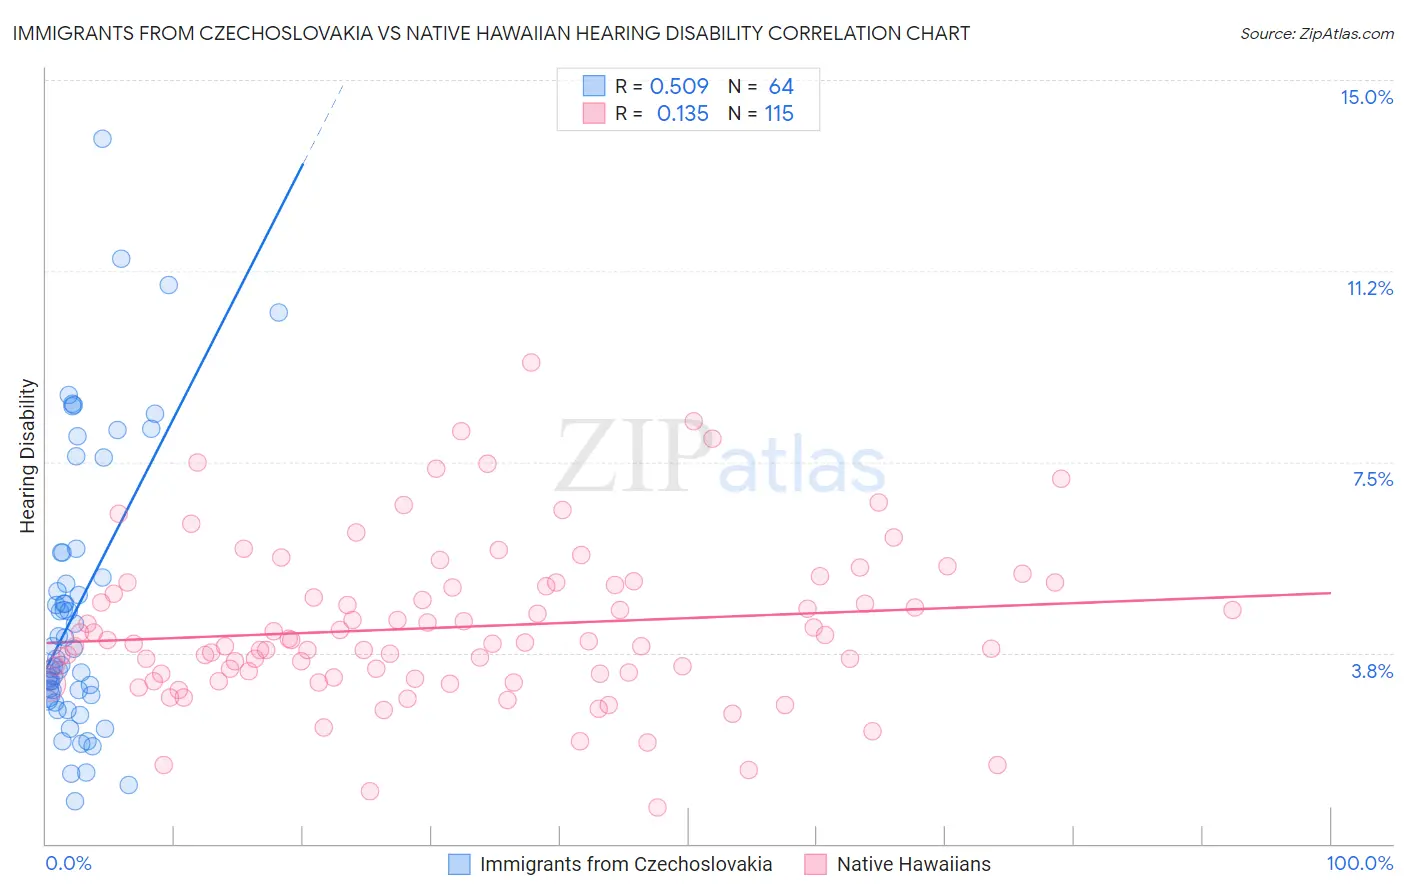
Immigrants from Czechoslovakia vs Native Hawaiian Hearing Disability Correlation Chart
The statistical analysis conducted on geographies consisting of 195,448,522 people shows a substantial positive correlation between the proportion of Immigrants from Czechoslovakia and percentage of population with hearing disability in the United States with a correlation coefficient (R) of 0.509 and weighted average of 3.1%. Similarly, the statistical analysis conducted on geographies consisting of 331,966,611 people shows a poor positive correlation between the proportion of Native Hawaiians and percentage of population with hearing disability in the United States with a correlation coefficient (R) of 0.135 and weighted average of 3.7%, a difference of 18.5%.
Hearing Disability Correlation Summary
| Measurement | Immigrants from Czechoslovakia | Native Hawaiian |
| Minimum | 0.83% | 0.70% |
| Maximum | 13.9% | 9.4% |
| Range | 13.0% | 8.7% |
| Mean | 4.7% | 4.3% |
| Median | 3.7% | 4.0% |
| Interquartile 25% (IQ1) | 2.9% | 3.3% |
| Interquartile 75% (IQ3) | 5.7% | 5.1% |
| Interquartile Range (IQR) | 2.8% | 1.7% |
| Standard Deviation (Sample) | 2.8% | 1.6% |
| Standard Deviation (Population) | 2.8% | 1.5% |
Similar Demographics by Hearing Disability
Demographics Similar to Immigrants from Czechoslovakia by Hearing Disability
In terms of hearing disability, the demographic groups most similar to Immigrants from Czechoslovakia are Alsatian (3.1%, a difference of 0.0%), Immigrants from Denmark (3.1%, a difference of 0.050%), Eastern European (3.1%, a difference of 0.070%), Immigrants from Thailand (3.1%, a difference of 0.090%), and Hispanic or Latino (3.1%, a difference of 0.13%).
| Demographics | Rating | Rank | Hearing Disability |
| Immigrants | Bosnia and Herzegovina | 20.6 /100 | #197 | Fair 3.1% |
| Immigrants | Croatia | 20.5 /100 | #198 | Fair 3.1% |
| Syrians | 19.2 /100 | #199 | Poor 3.1% |
| Immigrants | North Macedonia | 19.1 /100 | #200 | Poor 3.1% |
| Iraqis | 19.0 /100 | #201 | Poor 3.1% |
| Immigrants | Thailand | 16.4 /100 | #202 | Poor 3.1% |
| Immigrants | Denmark | 16.2 /100 | #203 | Poor 3.1% |
| Immigrants | Czechoslovakia | 15.9 /100 | #204 | Poor 3.1% |
| Alsatians | 15.9 /100 | #205 | Poor 3.1% |
| Eastern Europeans | 15.5 /100 | #206 | Poor 3.1% |
| Hispanics or Latinos | 15.1 /100 | #207 | Poor 3.1% |
| Immigrants | Latvia | 12.7 /100 | #208 | Poor 3.1% |
| Immigrants | Hungary | 12.5 /100 | #209 | Poor 3.1% |
| Cape Verdeans | 12.2 /100 | #210 | Poor 3.1% |
| Romanians | 12.1 /100 | #211 | Poor 3.1% |
Demographics Similar to Native Hawaiians by Hearing Disability
In terms of hearing disability, the demographic groups most similar to Native Hawaiians are Finnish (3.7%, a difference of 0.060%), Norwegian (3.7%, a difference of 0.060%), White/Caucasian (3.7%, a difference of 0.080%), Chinese (3.7%, a difference of 0.21%), and Iroquois (3.7%, a difference of 0.30%).
| Demographics | Rating | Rank | Hearing Disability |
| Sioux | 0.0 /100 | #285 | Tragic 3.6% |
| Delaware | 0.0 /100 | #286 | Tragic 3.6% |
| Spanish | 0.0 /100 | #287 | Tragic 3.7% |
| Irish | 0.0 /100 | #288 | Tragic 3.7% |
| Chinese | 0.0 /100 | #289 | Tragic 3.7% |
| Whites/Caucasians | 0.0 /100 | #290 | Tragic 3.7% |
| Finns | 0.0 /100 | #291 | Tragic 3.7% |
| Native Hawaiians | 0.0 /100 | #292 | Tragic 3.7% |
| Norwegians | 0.0 /100 | #293 | Tragic 3.7% |
| Iroquois | 0.0 /100 | #294 | Tragic 3.7% |
| Welsh | 0.0 /100 | #295 | Tragic 3.7% |
| Pima | 0.0 /100 | #296 | Tragic 3.7% |
| Immigrants | Azores | 0.0 /100 | #297 | Tragic 3.7% |
| Celtics | 0.0 /100 | #298 | Tragic 3.7% |
| Germans | 0.0 /100 | #299 | Tragic 3.7% |