Immigrants from Czechoslovakia vs Taiwanese Hearing Disability
COMPARE
Immigrants from Czechoslovakia
Taiwanese
Hearing Disability
Hearing Disability Comparison
Immigrants from Czechoslovakia
Taiwanese
3.1%
HEARING DISABILITY
15.9/ 100
METRIC RATING
204th/ 347
METRIC RANK
2.8%
HEARING DISABILITY
94.8/ 100
METRIC RATING
102nd/ 347
METRIC RANK
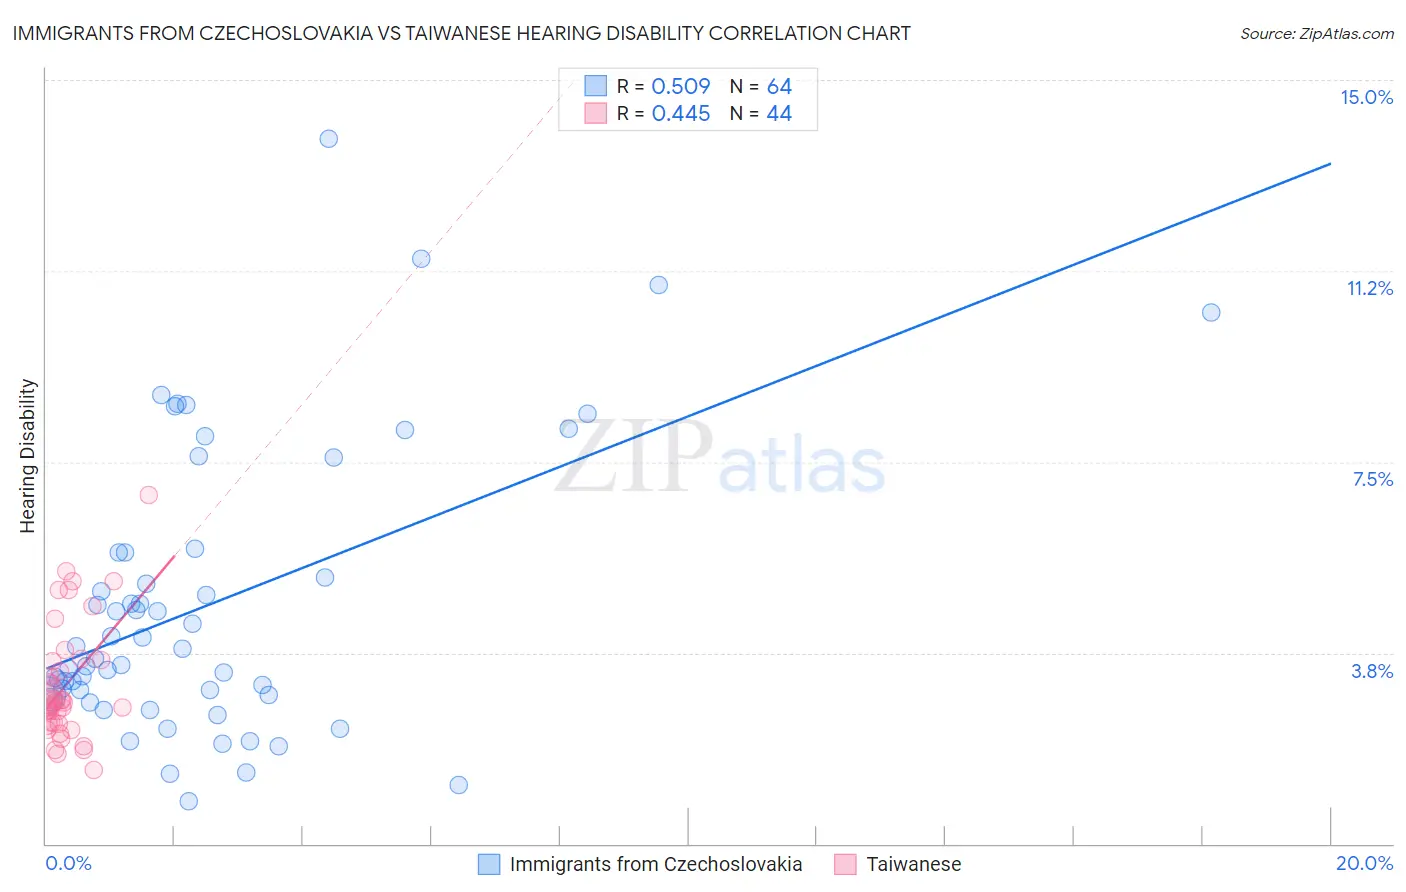
Immigrants from Czechoslovakia vs Taiwanese Hearing Disability Correlation Chart
The statistical analysis conducted on geographies consisting of 195,448,522 people shows a substantial positive correlation between the proportion of Immigrants from Czechoslovakia and percentage of population with hearing disability in the United States with a correlation coefficient (R) of 0.509 and weighted average of 3.1%. Similarly, the statistical analysis conducted on geographies consisting of 31,724,936 people shows a moderate positive correlation between the proportion of Taiwanese and percentage of population with hearing disability in the United States with a correlation coefficient (R) of 0.445 and weighted average of 2.8%, a difference of 11.5%.
Hearing Disability Correlation Summary
| Measurement | Immigrants from Czechoslovakia | Taiwanese |
| Minimum | 0.83% | 1.5% |
| Maximum | 13.9% | 6.9% |
| Range | 13.0% | 5.4% |
| Mean | 4.7% | 3.1% |
| Median | 3.7% | 2.8% |
| Interquartile 25% (IQ1) | 2.9% | 2.4% |
| Interquartile 75% (IQ3) | 5.7% | 3.6% |
| Interquartile Range (IQR) | 2.8% | 1.2% |
| Standard Deviation (Sample) | 2.8% | 1.2% |
| Standard Deviation (Population) | 2.8% | 1.1% |
Similar Demographics by Hearing Disability
Demographics Similar to Immigrants from Czechoslovakia by Hearing Disability
In terms of hearing disability, the demographic groups most similar to Immigrants from Czechoslovakia are Alsatian (3.1%, a difference of 0.0%), Immigrants from Denmark (3.1%, a difference of 0.050%), Eastern European (3.1%, a difference of 0.070%), Immigrants from Thailand (3.1%, a difference of 0.090%), and Hispanic or Latino (3.1%, a difference of 0.13%).
| Demographics | Rating | Rank | Hearing Disability |
| Immigrants | Bosnia and Herzegovina | 20.6 /100 | #197 | Fair 3.1% |
| Immigrants | Croatia | 20.5 /100 | #198 | Fair 3.1% |
| Syrians | 19.2 /100 | #199 | Poor 3.1% |
| Immigrants | North Macedonia | 19.1 /100 | #200 | Poor 3.1% |
| Iraqis | 19.0 /100 | #201 | Poor 3.1% |
| Immigrants | Thailand | 16.4 /100 | #202 | Poor 3.1% |
| Immigrants | Denmark | 16.2 /100 | #203 | Poor 3.1% |
| Immigrants | Czechoslovakia | 15.9 /100 | #204 | Poor 3.1% |
| Alsatians | 15.9 /100 | #205 | Poor 3.1% |
| Eastern Europeans | 15.5 /100 | #206 | Poor 3.1% |
| Hispanics or Latinos | 15.1 /100 | #207 | Poor 3.1% |
| Immigrants | Latvia | 12.7 /100 | #208 | Poor 3.1% |
| Immigrants | Hungary | 12.5 /100 | #209 | Poor 3.1% |
| Cape Verdeans | 12.2 /100 | #210 | Poor 3.1% |
| Romanians | 12.1 /100 | #211 | Poor 3.1% |
Demographics Similar to Taiwanese by Hearing Disability
In terms of hearing disability, the demographic groups most similar to Taiwanese are Immigrants from Spain (2.8%, a difference of 0.010%), Immigrants from Indonesia (2.8%, a difference of 0.050%), Immigrants from Eastern Africa (2.8%, a difference of 0.070%), Immigrants from Guatemala (2.8%, a difference of 0.12%), and Immigrants from Honduras (2.8%, a difference of 0.16%).
| Demographics | Rating | Rank | Hearing Disability |
| Israelis | 95.9 /100 | #95 | Exceptional 2.8% |
| Immigrants | Somalia | 95.5 /100 | #96 | Exceptional 2.8% |
| Immigrants | Afghanistan | 95.3 /100 | #97 | Exceptional 2.8% |
| Immigrants | Honduras | 95.1 /100 | #98 | Exceptional 2.8% |
| Immigrants | Guatemala | 95.1 /100 | #99 | Exceptional 2.8% |
| Immigrants | Eastern Africa | 95.0 /100 | #100 | Exceptional 2.8% |
| Immigrants | Spain | 94.9 /100 | #101 | Exceptional 2.8% |
| Taiwanese | 94.8 /100 | #102 | Exceptional 2.8% |
| Immigrants | Indonesia | 94.7 /100 | #103 | Exceptional 2.8% |
| Burmese | 94.2 /100 | #104 | Exceptional 2.8% |
| Moroccans | 93.9 /100 | #105 | Exceptional 2.8% |
| Hondurans | 93.4 /100 | #106 | Exceptional 2.8% |
| Immigrants | Chile | 93.4 /100 | #107 | Exceptional 2.8% |
| Guatemalans | 93.2 /100 | #108 | Exceptional 2.8% |
| Turks | 93.0 /100 | #109 | Exceptional 2.8% |