Immigrants from Micronesia vs Bolivian Vision Disability
COMPARE
Immigrants from Micronesia
Bolivian
Vision Disability
Vision Disability Comparison
Immigrants from Micronesia
Bolivians
2.4%
VISION DISABILITY
0.3/ 100
METRIC RATING
252nd/ 347
METRIC RANK
1.9%
VISION DISABILITY
100.0/ 100
METRIC RATING
18th/ 347
METRIC RANK
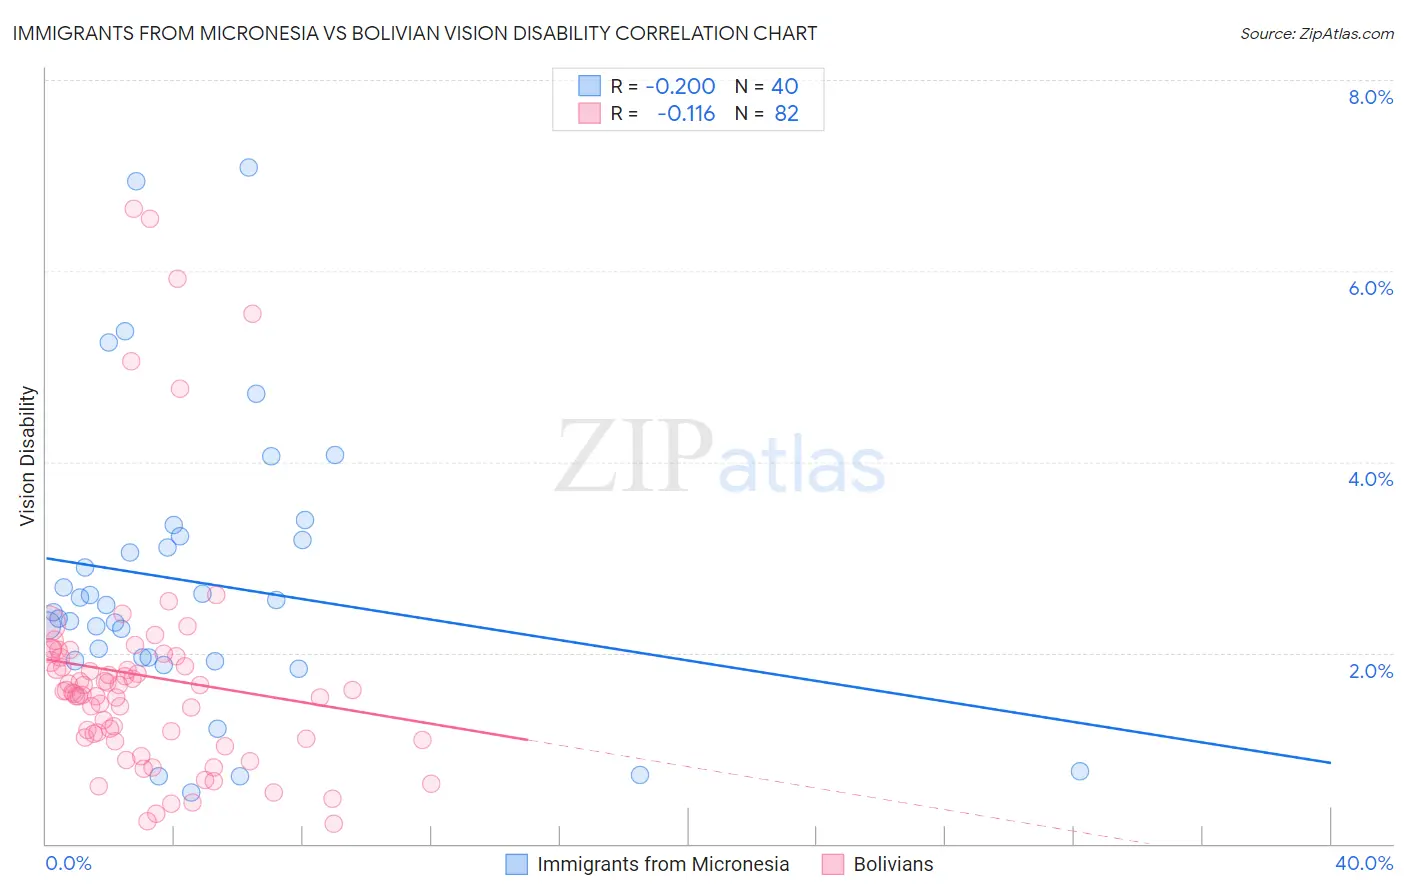
Immigrants from Micronesia vs Bolivian Vision Disability Correlation Chart
The statistical analysis conducted on geographies consisting of 61,592,184 people shows a weak negative correlation between the proportion of Immigrants from Micronesia and percentage of population with vision disability in the United States with a correlation coefficient (R) of -0.200 and weighted average of 2.4%. Similarly, the statistical analysis conducted on geographies consisting of 184,625,860 people shows a poor negative correlation between the proportion of Bolivians and percentage of population with vision disability in the United States with a correlation coefficient (R) of -0.116 and weighted average of 1.9%, a difference of 27.0%.
Vision Disability Correlation Summary
| Measurement | Immigrants from Micronesia | Bolivian |
| Minimum | 0.53% | 0.21% |
| Maximum | 7.1% | 6.7% |
| Range | 6.5% | 6.4% |
| Mean | 2.7% | 1.8% |
| Median | 2.5% | 1.6% |
| Interquartile 25% (IQ1) | 1.9% | 1.1% |
| Interquartile 75% (IQ3) | 3.2% | 2.0% |
| Interquartile Range (IQR) | 1.3% | 0.85% |
| Standard Deviation (Sample) | 1.5% | 1.3% |
| Standard Deviation (Population) | 1.5% | 1.3% |
Similar Demographics by Vision Disability
Demographics Similar to Immigrants from Micronesia by Vision Disability
In terms of vision disability, the demographic groups most similar to Immigrants from Micronesia are Japanese (2.4%, a difference of 0.070%), Immigrants from Laos (2.4%, a difference of 0.32%), Haitian (2.4%, a difference of 0.35%), Immigrants from Guatemala (2.4%, a difference of 0.38%), and Bangladeshi (2.3%, a difference of 0.43%).
| Demographics | Rating | Rank | Vision Disability |
| Alsatians | 0.6 /100 | #245 | Tragic 2.3% |
| French | 0.5 /100 | #246 | Tragic 2.3% |
| Guatemalans | 0.5 /100 | #247 | Tragic 2.3% |
| Sub-Saharan Africans | 0.5 /100 | #248 | Tragic 2.3% |
| Liberians | 0.5 /100 | #249 | Tragic 2.3% |
| Bangladeshis | 0.5 /100 | #250 | Tragic 2.3% |
| Immigrants | Laos | 0.4 /100 | #251 | Tragic 2.4% |
| Immigrants | Micronesia | 0.3 /100 | #252 | Tragic 2.4% |
| Japanese | 0.3 /100 | #253 | Tragic 2.4% |
| Haitians | 0.3 /100 | #254 | Tragic 2.4% |
| Immigrants | Guatemala | 0.3 /100 | #255 | Tragic 2.4% |
| Immigrants | Haiti | 0.2 /100 | #256 | Tragic 2.4% |
| West Indians | 0.2 /100 | #257 | Tragic 2.4% |
| British West Indians | 0.2 /100 | #258 | Tragic 2.4% |
| Whites/Caucasians | 0.2 /100 | #259 | Tragic 2.4% |
Demographics Similar to Bolivians by Vision Disability
In terms of vision disability, the demographic groups most similar to Bolivians are Indian (Asian) (1.8%, a difference of 0.42%), Burmese (1.8%, a difference of 0.42%), Immigrants from Bolivia (1.8%, a difference of 0.87%), Immigrants from Sri Lanka (1.9%, a difference of 1.2%), and Immigrants from China (1.8%, a difference of 1.3%).
| Demographics | Rating | Rank | Vision Disability |
| Immigrants | Israel | 100.0 /100 | #11 | Exceptional 1.8% |
| Immigrants | Korea | 100.0 /100 | #12 | Exceptional 1.8% |
| Immigrants | Eastern Asia | 100.0 /100 | #13 | Exceptional 1.8% |
| Immigrants | China | 100.0 /100 | #14 | Exceptional 1.8% |
| Immigrants | Bolivia | 100.0 /100 | #15 | Exceptional 1.8% |
| Indians (Asian) | 100.0 /100 | #16 | Exceptional 1.8% |
| Burmese | 100.0 /100 | #17 | Exceptional 1.8% |
| Bolivians | 100.0 /100 | #18 | Exceptional 1.9% |
| Immigrants | Sri Lanka | 100.0 /100 | #19 | Exceptional 1.9% |
| Asians | 100.0 /100 | #20 | Exceptional 1.9% |
| Turks | 100.0 /100 | #21 | Exceptional 1.9% |
| Immigrants | Pakistan | 100.0 /100 | #22 | Exceptional 1.9% |
| Immigrants | Asia | 99.9 /100 | #23 | Exceptional 1.9% |
| Immigrants | Lithuania | 99.9 /100 | #24 | Exceptional 1.9% |
| Bulgarians | 99.9 /100 | #25 | Exceptional 1.9% |