Immigrants from Costa Rica vs Scotch-Irish Master's Degree
COMPARE
Immigrants from Costa Rica
Scotch-Irish
Master's Degree
Master's Degree Comparison
Immigrants from Costa Rica
Scotch-Irish
14.7%
MASTER'S DEGREE
36.2/ 100
METRIC RATING
188th/ 347
METRIC RANK
14.4%
MASTER'S DEGREE
25.0/ 100
METRIC RATING
201st/ 347
METRIC RANK
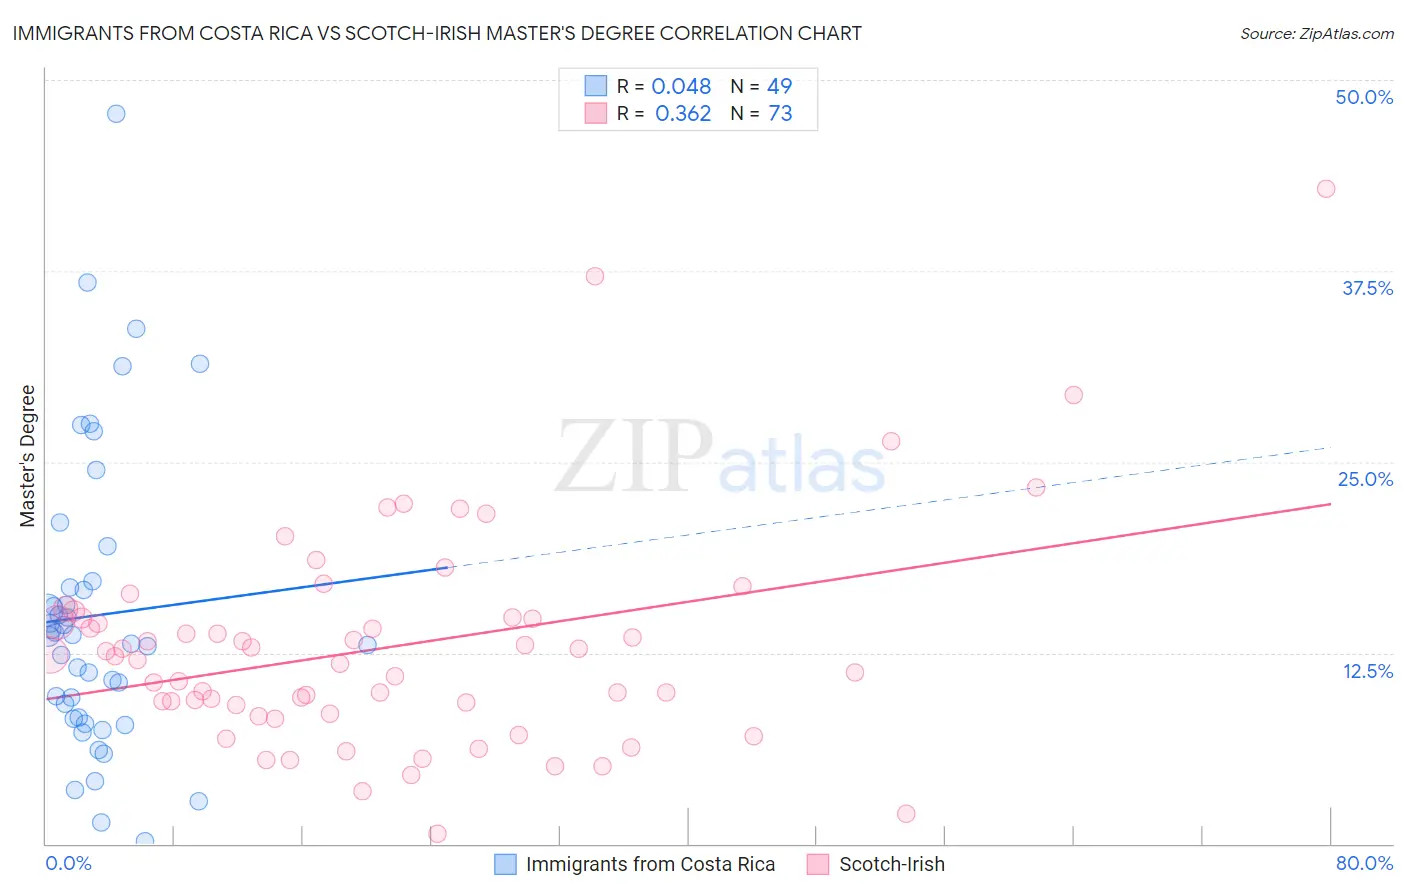
Immigrants from Costa Rica vs Scotch-Irish Master's Degree Correlation Chart
The statistical analysis conducted on geographies consisting of 204,272,848 people shows no correlation between the proportion of Immigrants from Costa Rica and percentage of population with at least master's degree education in the United States with a correlation coefficient (R) of 0.048 and weighted average of 14.7%. Similarly, the statistical analysis conducted on geographies consisting of 548,205,332 people shows a mild positive correlation between the proportion of Scotch-Irish and percentage of population with at least master's degree education in the United States with a correlation coefficient (R) of 0.362 and weighted average of 14.4%, a difference of 1.8%.
Master's Degree Correlation Summary
| Measurement | Immigrants from Costa Rica | Scotch-Irish |
| Minimum | 0.13% | 0.67% |
| Maximum | 47.8% | 42.9% |
| Range | 47.7% | 42.2% |
| Mean | 15.0% | 12.9% |
| Median | 13.6% | 12.3% |
| Interquartile 25% (IQ1) | 8.2% | 8.8% |
| Interquartile 75% (IQ3) | 17.0% | 14.8% |
| Interquartile Range (IQR) | 8.8% | 6.0% |
| Standard Deviation (Sample) | 9.7% | 7.2% |
| Standard Deviation (Population) | 9.6% | 7.1% |
Demographics Similar to Immigrants from Costa Rica and Scotch-Irish by Master's Degree
In terms of master's degree, the demographic groups most similar to Immigrants from Costa Rica are Basque (14.7%, a difference of 0.040%), Immigrants (14.6%, a difference of 0.040%), Spaniard (14.6%, a difference of 0.060%), Immigrants from Oceania (14.7%, a difference of 0.12%), and Barbadian (14.7%, a difference of 0.29%). Similarly, the demographic groups most similar to Scotch-Irish are Panamanian (14.4%, a difference of 0.010%), Immigrants from Western Africa (14.4%, a difference of 0.010%), Yugoslavian (14.4%, a difference of 0.13%), French (14.4%, a difference of 0.24%), and Immigrants from Armenia (14.5%, a difference of 0.37%).
| Demographics | Rating | Rank | Master's Degree |
| Immigrants | Zaire | 39.5 /100 | #184 | Fair 14.7% |
| Barbadians | 38.3 /100 | #185 | Fair 14.7% |
| Immigrants | Oceania | 37.1 /100 | #186 | Fair 14.7% |
| Basques | 36.5 /100 | #187 | Fair 14.7% |
| Immigrants | Costa Rica | 36.2 /100 | #188 | Fair 14.7% |
| Immigrants | Immigrants | 36.0 /100 | #189 | Fair 14.6% |
| Spaniards | 35.8 /100 | #190 | Fair 14.6% |
| Welsh | 34.2 /100 | #191 | Fair 14.6% |
| Immigrants | Middle Africa | 33.6 /100 | #192 | Fair 14.6% |
| Immigrants | Nigeria | 32.7 /100 | #193 | Fair 14.6% |
| Chinese | 32.5 /100 | #194 | Fair 14.6% |
| Danes | 31.3 /100 | #195 | Fair 14.5% |
| Czechoslovakians | 29.9 /100 | #196 | Fair 14.5% |
| Belgians | 28.0 /100 | #197 | Fair 14.5% |
| West Indians | 27.4 /100 | #198 | Fair 14.5% |
| Immigrants | Armenia | 27.2 /100 | #199 | Fair 14.5% |
| Panamanians | 25.1 /100 | #200 | Fair 14.4% |
| Scotch-Irish | 25.0 /100 | #201 | Fair 14.4% |
| Immigrants | Western Africa | 24.9 /100 | #202 | Fair 14.4% |
| Yugoslavians | 24.3 /100 | #203 | Fair 14.4% |
| French | 23.7 /100 | #204 | Fair 14.4% |