Immigrants from Costa Rica vs Immigrants from Kuwait Self-Care Disability
COMPARE
Immigrants from Costa Rica
Immigrants from Kuwait
Self-Care Disability
Self-Care Disability Comparison
Immigrants from Costa Rica
Immigrants from Kuwait
2.4%
SELF-CARE DISABILITY
75.1/ 100
METRIC RATING
150th/ 347
METRIC RANK
2.2%
SELF-CARE DISABILITY
100.0/ 100
METRIC RATING
16th/ 347
METRIC RANK
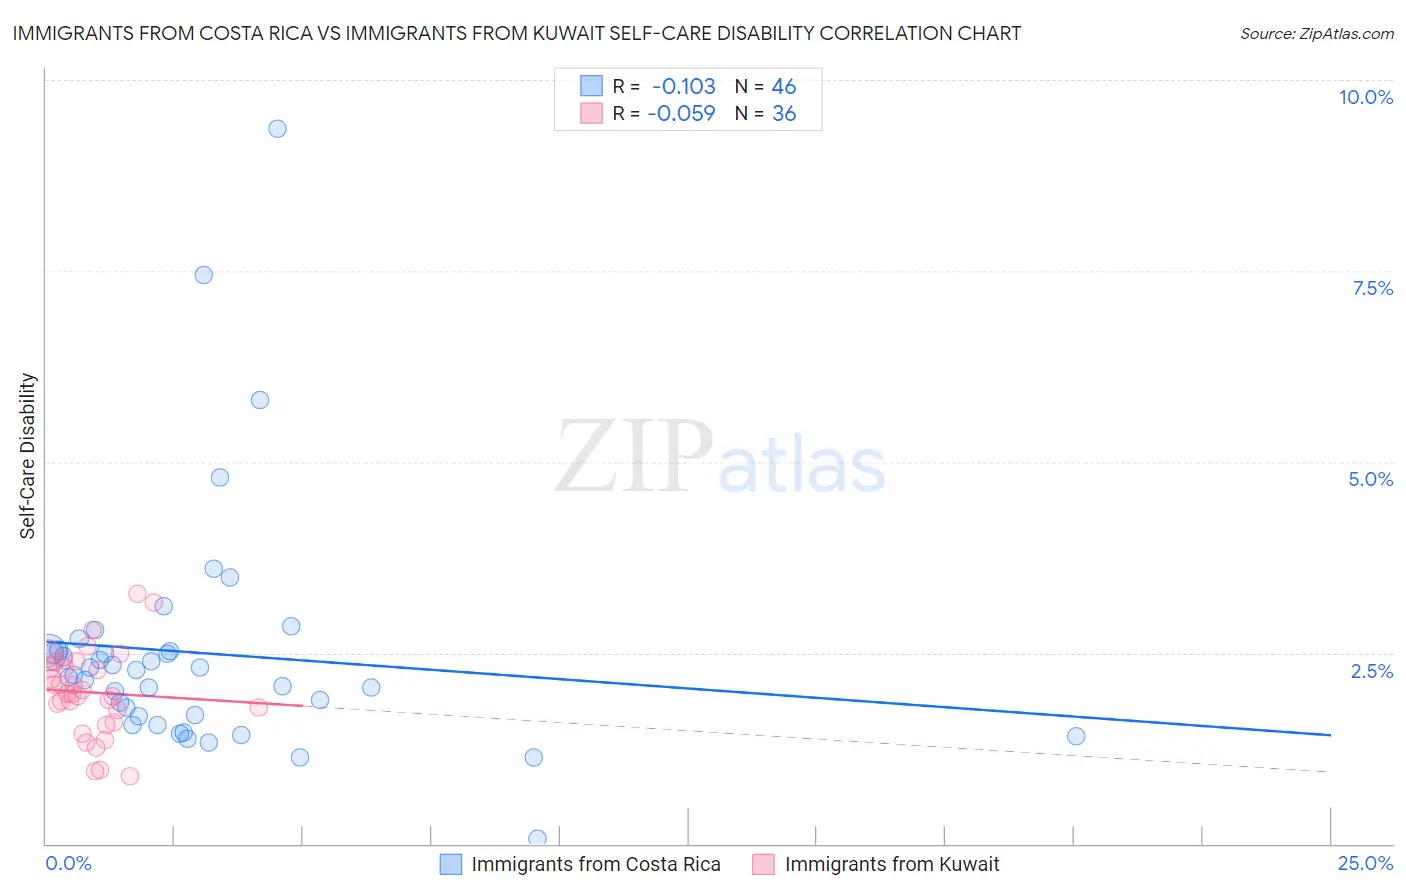
Immigrants from Costa Rica vs Immigrants from Kuwait Self-Care Disability Correlation Chart
The statistical analysis conducted on geographies consisting of 204,207,185 people shows a poor negative correlation between the proportion of Immigrants from Costa Rica and percentage of population with self-care disability in the United States with a correlation coefficient (R) of -0.103 and weighted average of 2.4%. Similarly, the statistical analysis conducted on geographies consisting of 136,859,036 people shows a slight negative correlation between the proportion of Immigrants from Kuwait and percentage of population with self-care disability in the United States with a correlation coefficient (R) of -0.059 and weighted average of 2.2%, a difference of 10.4%.
Self-Care Disability Correlation Summary
| Measurement | Immigrants from Costa Rica | Immigrants from Kuwait |
| Minimum | 0.069% | 0.88% |
| Maximum | 9.4% | 3.3% |
| Range | 9.3% | 2.4% |
| Mean | 2.5% | 2.0% |
| Median | 2.2% | 2.0% |
| Interquartile 25% (IQ1) | 1.7% | 1.7% |
| Interquartile 75% (IQ3) | 2.5% | 2.3% |
| Interquartile Range (IQR) | 0.85% | 0.67% |
| Standard Deviation (Sample) | 1.6% | 0.56% |
| Standard Deviation (Population) | 1.6% | 0.55% |
Similar Demographics by Self-Care Disability
Demographics Similar to Immigrants from Costa Rica by Self-Care Disability
In terms of self-care disability, the demographic groups most similar to Immigrants from Costa Rica are Arab (2.4%, a difference of 0.040%), Romanian (2.4%, a difference of 0.050%), Basque (2.4%, a difference of 0.070%), Tlingit-Haida (2.4%, a difference of 0.10%), and Immigrants from England (2.4%, a difference of 0.10%).
| Demographics | Rating | Rank | Self-Care Disability |
| Afghans | 82.3 /100 | #143 | Excellent 2.4% |
| Costa Ricans | 80.8 /100 | #144 | Excellent 2.4% |
| Germans | 80.1 /100 | #145 | Excellent 2.4% |
| Israelis | 80.0 /100 | #146 | Good 2.4% |
| Dutch | 77.5 /100 | #147 | Good 2.4% |
| Romanians | 75.8 /100 | #148 | Good 2.4% |
| Arabs | 75.7 /100 | #149 | Good 2.4% |
| Immigrants | Costa Rica | 75.1 /100 | #150 | Good 2.4% |
| Basques | 74.0 /100 | #151 | Good 2.4% |
| Tlingit-Haida | 73.5 /100 | #152 | Good 2.4% |
| Immigrants | England | 73.5 /100 | #153 | Good 2.4% |
| Italians | 72.2 /100 | #154 | Good 2.4% |
| Pakistanis | 71.4 /100 | #155 | Good 2.4% |
| Nigerians | 70.6 /100 | #156 | Good 2.4% |
| Immigrants | Europe | 69.6 /100 | #157 | Good 2.4% |
Demographics Similar to Immigrants from Kuwait by Self-Care Disability
In terms of self-care disability, the demographic groups most similar to Immigrants from Kuwait are Immigrants from Saudi Arabia (2.2%, a difference of 0.16%), Okinawan (2.2%, a difference of 0.28%), Luxembourger (2.2%, a difference of 0.29%), Immigrants from Taiwan (2.2%, a difference of 0.42%), and Ethiopian (2.2%, a difference of 0.45%).
| Demographics | Rating | Rank | Self-Care Disability |
| Immigrants | Nepal | 100.0 /100 | #9 | Exceptional 2.2% |
| Sudanese | 100.0 /100 | #10 | Exceptional 2.2% |
| Immigrants | South Central Asia | 100.0 /100 | #11 | Exceptional 2.2% |
| Immigrants | Ethiopia | 100.0 /100 | #12 | Exceptional 2.2% |
| Ethiopians | 100.0 /100 | #13 | Exceptional 2.2% |
| Luxembourgers | 100.0 /100 | #14 | Exceptional 2.2% |
| Okinawans | 100.0 /100 | #15 | Exceptional 2.2% |
| Immigrants | Kuwait | 100.0 /100 | #16 | Exceptional 2.2% |
| Immigrants | Saudi Arabia | 100.0 /100 | #17 | Exceptional 2.2% |
| Immigrants | Taiwan | 100.0 /100 | #18 | Exceptional 2.2% |
| Immigrants | Eritrea | 100.0 /100 | #19 | Exceptional 2.2% |
| Tongans | 100.0 /100 | #20 | Exceptional 2.2% |
| Bulgarians | 100.0 /100 | #21 | Exceptional 2.2% |
| Immigrants | Venezuela | 100.0 /100 | #22 | Exceptional 2.2% |
| Cambodians | 100.0 /100 | #23 | Exceptional 2.2% |