Australian vs Immigrants from Kuwait Self-Care Disability
COMPARE
Australian
Immigrants from Kuwait
Self-Care Disability
Self-Care Disability Comparison
Australians
Immigrants from Kuwait
2.3%
SELF-CARE DISABILITY
99.6/ 100
METRIC RATING
53rd/ 347
METRIC RANK
2.2%
SELF-CARE DISABILITY
100.0/ 100
METRIC RATING
16th/ 347
METRIC RANK
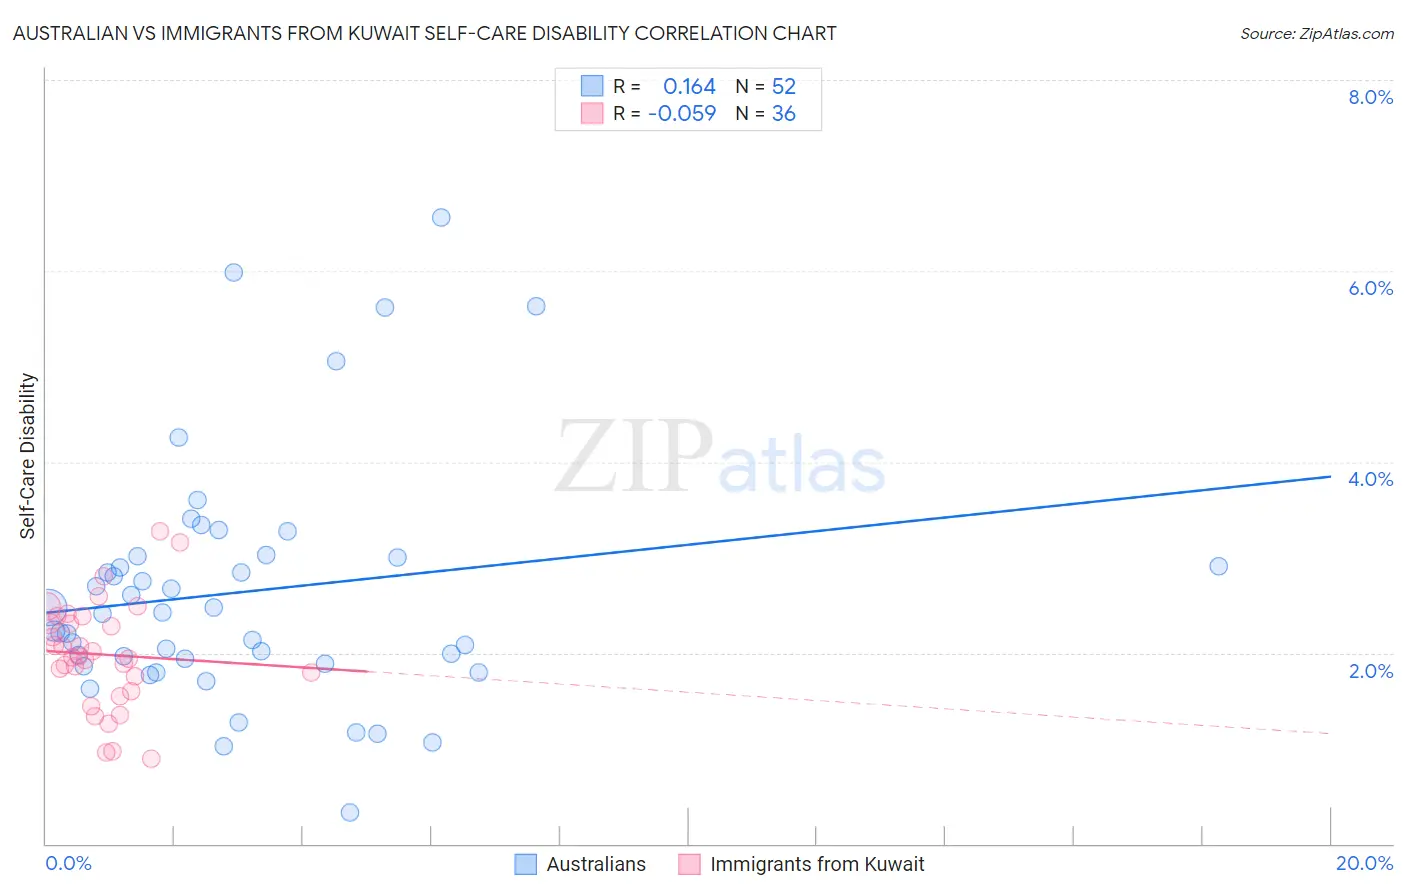
Australian vs Immigrants from Kuwait Self-Care Disability Correlation Chart
The statistical analysis conducted on geographies consisting of 223,956,744 people shows a poor positive correlation between the proportion of Australians and percentage of population with self-care disability in the United States with a correlation coefficient (R) of 0.164 and weighted average of 2.3%. Similarly, the statistical analysis conducted on geographies consisting of 136,859,036 people shows a slight negative correlation between the proportion of Immigrants from Kuwait and percentage of population with self-care disability in the United States with a correlation coefficient (R) of -0.059 and weighted average of 2.2%, a difference of 4.4%.
Self-Care Disability Correlation Summary
| Measurement | Australian | Immigrants from Kuwait |
| Minimum | 0.32% | 0.88% |
| Maximum | 6.6% | 3.3% |
| Range | 6.2% | 2.4% |
| Mean | 2.6% | 2.0% |
| Median | 2.4% | 2.0% |
| Interquartile 25% (IQ1) | 1.9% | 1.7% |
| Interquartile 75% (IQ3) | 3.0% | 2.3% |
| Interquartile Range (IQR) | 1.1% | 0.67% |
| Standard Deviation (Sample) | 1.3% | 0.56% |
| Standard Deviation (Population) | 1.3% | 0.55% |
Similar Demographics by Self-Care Disability
Demographics Similar to Australians by Self-Care Disability
In terms of self-care disability, the demographic groups most similar to Australians are Immigrants from Serbia (2.3%, a difference of 0.030%), Argentinean (2.3%, a difference of 0.050%), Kenyan (2.3%, a difference of 0.060%), Immigrants from France (2.3%, a difference of 0.11%), and Immigrants from Eastern Asia (2.3%, a difference of 0.15%).
| Demographics | Rating | Rank | Self-Care Disability |
| Czechs | 99.8 /100 | #46 | Exceptional 2.3% |
| Jordanians | 99.7 /100 | #47 | Exceptional 2.3% |
| Immigrants | Malaysia | 99.7 /100 | #48 | Exceptional 2.3% |
| Latvians | 99.7 /100 | #49 | Exceptional 2.3% |
| Immigrants | Brazil | 99.7 /100 | #50 | Exceptional 2.3% |
| Kenyans | 99.7 /100 | #51 | Exceptional 2.3% |
| Immigrants | Serbia | 99.6 /100 | #52 | Exceptional 2.3% |
| Australians | 99.6 /100 | #53 | Exceptional 2.3% |
| Argentineans | 99.6 /100 | #54 | Exceptional 2.3% |
| Immigrants | France | 99.6 /100 | #55 | Exceptional 2.3% |
| Immigrants | Eastern Asia | 99.6 /100 | #56 | Exceptional 2.3% |
| Immigrants | Belgium | 99.6 /100 | #57 | Exceptional 2.3% |
| Immigrants | Cameroon | 99.6 /100 | #58 | Exceptional 2.3% |
| New Zealanders | 99.5 /100 | #59 | Exceptional 2.3% |
| Immigrants | Japan | 99.5 /100 | #60 | Exceptional 2.3% |
Demographics Similar to Immigrants from Kuwait by Self-Care Disability
In terms of self-care disability, the demographic groups most similar to Immigrants from Kuwait are Immigrants from Saudi Arabia (2.2%, a difference of 0.16%), Okinawan (2.2%, a difference of 0.28%), Luxembourger (2.2%, a difference of 0.29%), Immigrants from Taiwan (2.2%, a difference of 0.42%), and Ethiopian (2.2%, a difference of 0.45%).
| Demographics | Rating | Rank | Self-Care Disability |
| Immigrants | Nepal | 100.0 /100 | #9 | Exceptional 2.2% |
| Sudanese | 100.0 /100 | #10 | Exceptional 2.2% |
| Immigrants | South Central Asia | 100.0 /100 | #11 | Exceptional 2.2% |
| Immigrants | Ethiopia | 100.0 /100 | #12 | Exceptional 2.2% |
| Ethiopians | 100.0 /100 | #13 | Exceptional 2.2% |
| Luxembourgers | 100.0 /100 | #14 | Exceptional 2.2% |
| Okinawans | 100.0 /100 | #15 | Exceptional 2.2% |
| Immigrants | Kuwait | 100.0 /100 | #16 | Exceptional 2.2% |
| Immigrants | Saudi Arabia | 100.0 /100 | #17 | Exceptional 2.2% |
| Immigrants | Taiwan | 100.0 /100 | #18 | Exceptional 2.2% |
| Immigrants | Eritrea | 100.0 /100 | #19 | Exceptional 2.2% |
| Tongans | 100.0 /100 | #20 | Exceptional 2.2% |
| Bulgarians | 100.0 /100 | #21 | Exceptional 2.2% |
| Immigrants | Venezuela | 100.0 /100 | #22 | Exceptional 2.2% |
| Cambodians | 100.0 /100 | #23 | Exceptional 2.2% |