Immigrants from Chile vs Immigrants from Barbados Child Poverty Among Boys Under 16
COMPARE
Immigrants from Chile
Immigrants from Barbados
Child Poverty Among Boys Under 16
Child Poverty Among Boys Under 16 Comparison
Immigrants from Chile
Immigrants from Barbados
15.9%
CHILD POVERTY AMONG BOYS UNDER 16
74.8/ 100
METRIC RATING
159th/ 347
METRIC RANK
20.0%
CHILD POVERTY AMONG BOYS UNDER 16
0.0/ 100
METRIC RATING
277th/ 347
METRIC RANK
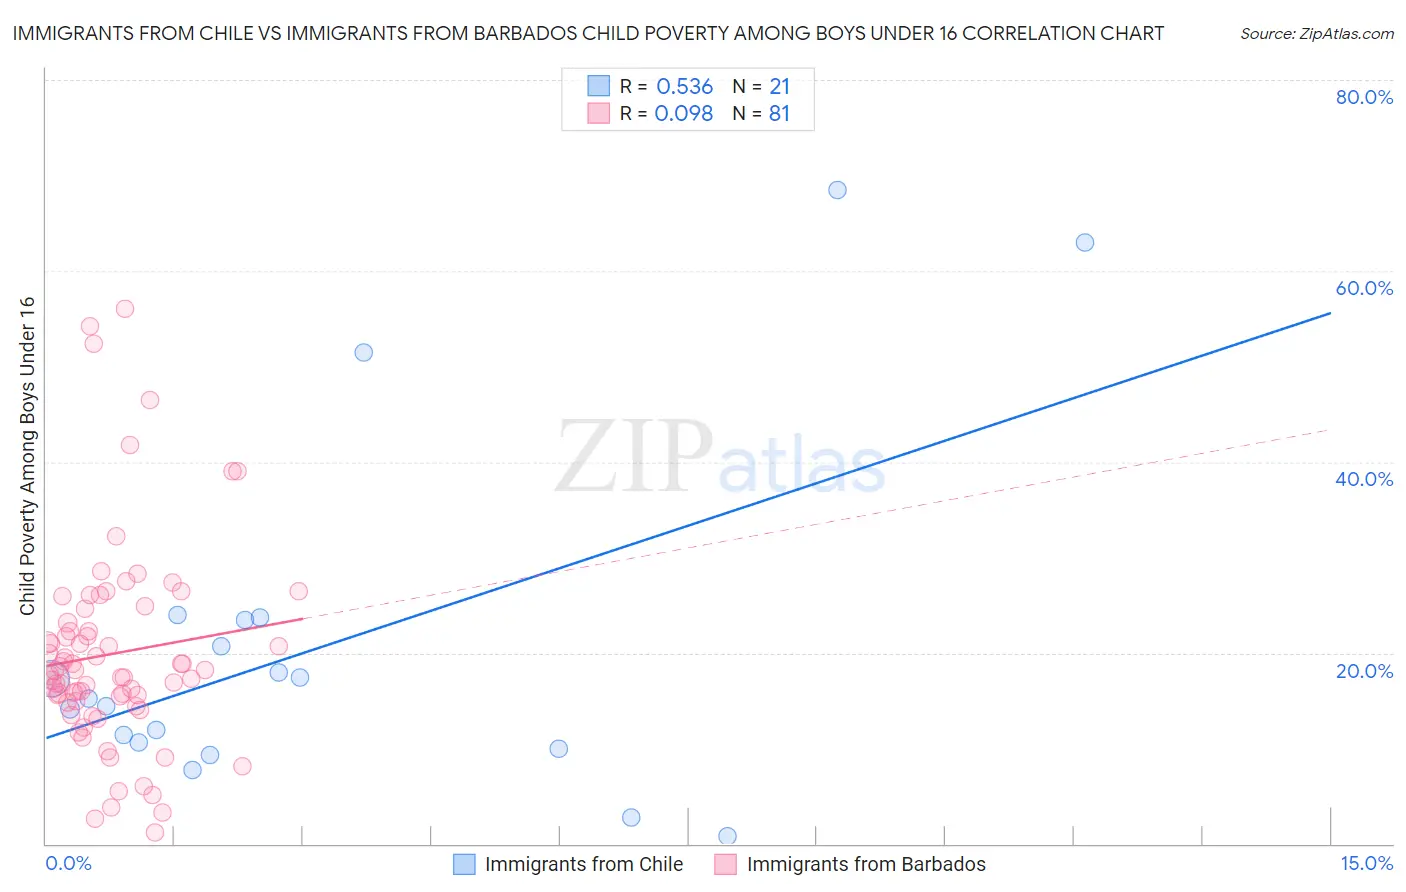
Immigrants from Chile vs Immigrants from Barbados Child Poverty Among Boys Under 16 Correlation Chart
The statistical analysis conducted on geographies consisting of 216,959,929 people shows a substantial positive correlation between the proportion of Immigrants from Chile and poverty level among boys under the age of 16 in the United States with a correlation coefficient (R) of 0.536 and weighted average of 15.9%. Similarly, the statistical analysis conducted on geographies consisting of 112,373,041 people shows a slight positive correlation between the proportion of Immigrants from Barbados and poverty level among boys under the age of 16 in the United States with a correlation coefficient (R) of 0.098 and weighted average of 20.0%, a difference of 25.5%.
Child Poverty Among Boys Under 16 Correlation Summary
| Measurement | Immigrants from Chile | Immigrants from Barbados |
| Minimum | 0.79% | 1.2% |
| Maximum | 68.4% | 56.1% |
| Range | 67.6% | 54.8% |
| Mean | 20.7% | 19.9% |
| Median | 15.2% | 18.0% |
| Interquartile 25% (IQ1) | 10.3% | 14.8% |
| Interquartile 75% (IQ3) | 23.5% | 23.9% |
| Interquartile Range (IQR) | 13.3% | 9.0% |
| Standard Deviation (Sample) | 18.1% | 10.7% |
| Standard Deviation (Population) | 17.7% | 10.6% |
Similar Demographics by Child Poverty Among Boys Under 16
Demographics Similar to Immigrants from Chile by Child Poverty Among Boys Under 16
In terms of child poverty among boys under 16, the demographic groups most similar to Immigrants from Chile are Yugoslavian (15.9%, a difference of 0.17%), Immigrants from Nepal (15.9%, a difference of 0.18%), Israeli (15.9%, a difference of 0.27%), French Canadian (15.9%, a difference of 0.28%), and Syrian (15.9%, a difference of 0.43%).
| Demographics | Rating | Rank | Child Poverty Among Boys Under 16 |
| Immigrants | Venezuela | 79.5 /100 | #152 | Good 15.8% |
| French | 78.7 /100 | #153 | Good 15.8% |
| Syrians | 77.5 /100 | #154 | Good 15.9% |
| French Canadians | 76.6 /100 | #155 | Good 15.9% |
| Israelis | 76.5 /100 | #156 | Good 15.9% |
| Immigrants | Nepal | 76.0 /100 | #157 | Good 15.9% |
| Yugoslavians | 75.9 /100 | #158 | Good 15.9% |
| Immigrants | Chile | 74.8 /100 | #159 | Good 15.9% |
| Immigrants | Northern Africa | 71.3 /100 | #160 | Good 16.0% |
| Immigrants | Oceania | 71.3 /100 | #161 | Good 16.0% |
| Guamanians/Chamorros | 69.6 /100 | #162 | Good 16.1% |
| Costa Ricans | 68.1 /100 | #163 | Good 16.1% |
| Immigrants | Albania | 67.9 /100 | #164 | Good 16.1% |
| Colombians | 65.2 /100 | #165 | Good 16.1% |
| Immigrants | Germany | 63.6 /100 | #166 | Good 16.2% |
Demographics Similar to Immigrants from Barbados by Child Poverty Among Boys Under 16
In terms of child poverty among boys under 16, the demographic groups most similar to Immigrants from Barbados are Immigrants from West Indies (20.0%, a difference of 0.020%), Subsaharan African (20.0%, a difference of 0.10%), Bangladeshi (20.0%, a difference of 0.15%), Jamaican (20.0%, a difference of 0.27%), and Central American (20.1%, a difference of 0.27%).
| Demographics | Rating | Rank | Child Poverty Among Boys Under 16 |
| Cherokee | 0.1 /100 | #270 | Tragic 19.7% |
| Chickasaw | 0.1 /100 | #271 | Tragic 19.8% |
| Immigrants | Ecuador | 0.1 /100 | #272 | Tragic 19.8% |
| Belizeans | 0.1 /100 | #273 | Tragic 19.9% |
| Immigrants | Bangladesh | 0.0 /100 | #274 | Tragic 19.9% |
| Jamaicans | 0.0 /100 | #275 | Tragic 20.0% |
| Sub-Saharan Africans | 0.0 /100 | #276 | Tragic 20.0% |
| Immigrants | Barbados | 0.0 /100 | #277 | Tragic 20.0% |
| Immigrants | West Indies | 0.0 /100 | #278 | Tragic 20.0% |
| Bangladeshis | 0.0 /100 | #279 | Tragic 20.0% |
| Central Americans | 0.0 /100 | #280 | Tragic 20.1% |
| Immigrants | Zaire | 0.0 /100 | #281 | Tragic 20.1% |
| Comanche | 0.0 /100 | #282 | Tragic 20.1% |
| Immigrants | Jamaica | 0.0 /100 | #283 | Tragic 20.1% |
| Barbadians | 0.0 /100 | #284 | Tragic 20.2% |