South American vs Nonimmigrants Hearing Disability
COMPARE
South American
Nonimmigrants
Hearing Disability
Hearing Disability Comparison
South Americans
Nonimmigrants
2.7%
HEARING DISABILITY
99.0/ 100
METRIC RATING
57th/ 347
METRIC RANK
3.6%
HEARING DISABILITY
0.0/ 100
METRIC RATING
277th/ 347
METRIC RANK
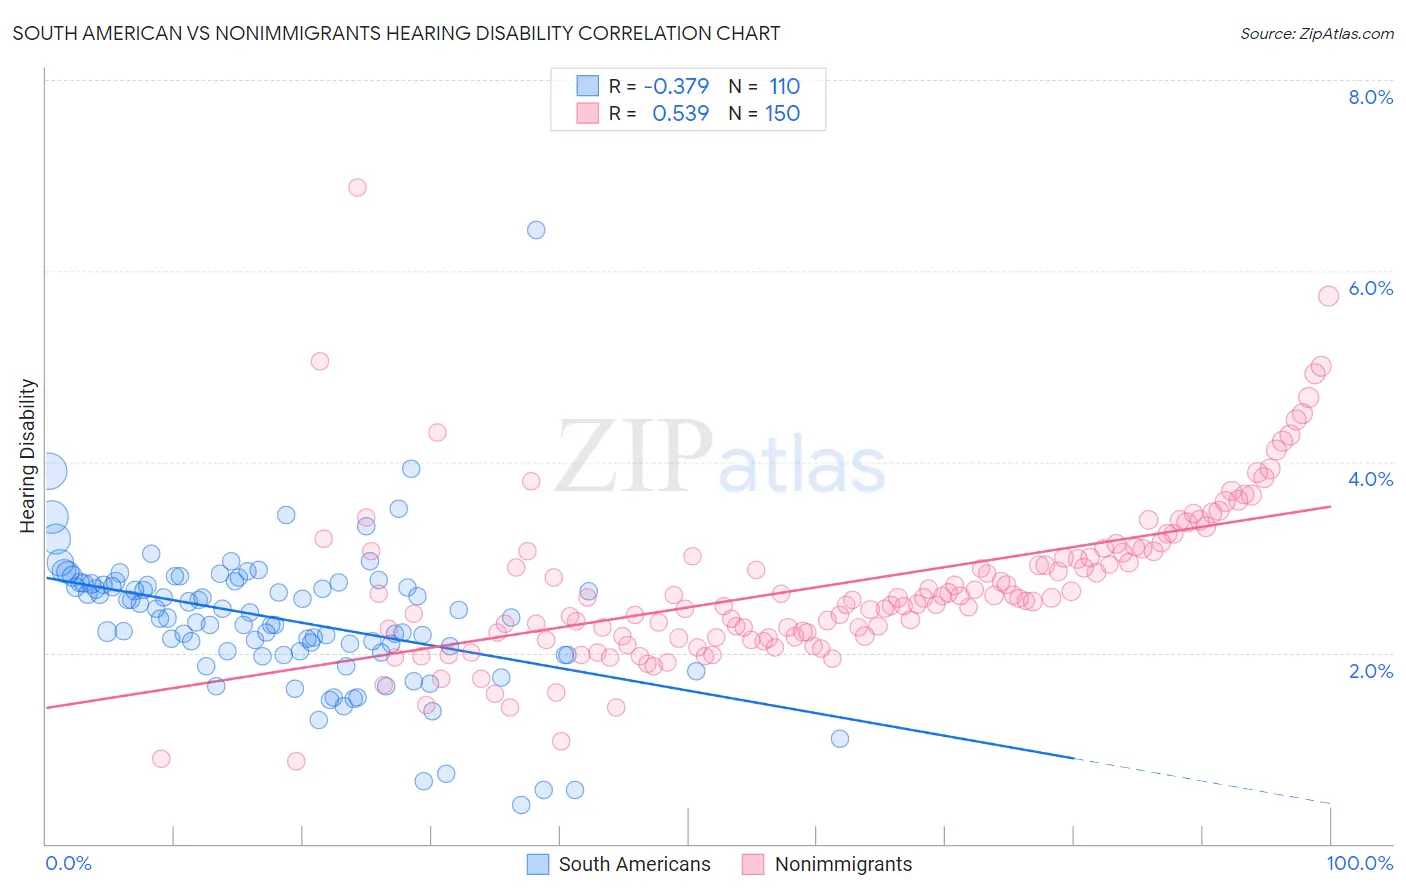
South American vs Nonimmigrants Hearing Disability Correlation Chart
The statistical analysis conducted on geographies consisting of 493,776,851 people shows a mild negative correlation between the proportion of South Americans and percentage of population with hearing disability in the United States with a correlation coefficient (R) of -0.379 and weighted average of 2.7%. Similarly, the statistical analysis conducted on geographies consisting of 583,885,168 people shows a substantial positive correlation between the proportion of Nonimmigrants and percentage of population with hearing disability in the United States with a correlation coefficient (R) of 0.539 and weighted average of 3.6%, a difference of 33.8%.
Hearing Disability Correlation Summary
| Measurement | South American | Nonimmigrants |
| Minimum | 0.40% | 0.87% |
| Maximum | 6.4% | 6.9% |
| Range | 6.0% | 6.0% |
| Mean | 2.4% | 2.7% |
| Median | 2.4% | 2.6% |
| Interquartile 25% (IQ1) | 2.0% | 2.2% |
| Interquartile 75% (IQ3) | 2.7% | 3.1% |
| Interquartile Range (IQR) | 0.71% | 0.92% |
| Standard Deviation (Sample) | 0.75% | 0.88% |
| Standard Deviation (Population) | 0.75% | 0.88% |
Similar Demographics by Hearing Disability
Demographics Similar to South Americans by Hearing Disability
In terms of hearing disability, the demographic groups most similar to South Americans are Immigrants from Nicaragua (2.7%, a difference of 0.040%), Immigrants from Ethiopia (2.7%, a difference of 0.070%), Ethiopian (2.7%, a difference of 0.13%), Immigrants from Eastern Asia (2.7%, a difference of 0.16%), and Jamaican (2.7%, a difference of 0.23%).
| Demographics | Rating | Rank | Hearing Disability |
| Paraguayans | 99.2 /100 | #50 | Exceptional 2.7% |
| Immigrants | Hong Kong | 99.2 /100 | #51 | Exceptional 2.7% |
| Jamaicans | 99.0 /100 | #52 | Exceptional 2.7% |
| Immigrants | Eastern Asia | 99.0 /100 | #53 | Exceptional 2.7% |
| Ethiopians | 99.0 /100 | #54 | Exceptional 2.7% |
| Immigrants | Ethiopia | 99.0 /100 | #55 | Exceptional 2.7% |
| Immigrants | Nicaragua | 99.0 /100 | #56 | Exceptional 2.7% |
| South Americans | 99.0 /100 | #57 | Exceptional 2.7% |
| Immigrants | Peru | 98.6 /100 | #58 | Exceptional 2.7% |
| Immigrants | Eritrea | 98.5 /100 | #59 | Exceptional 2.7% |
| Immigrants | Egypt | 98.5 /100 | #60 | Exceptional 2.7% |
| Immigrants | Uzbekistan | 98.4 /100 | #61 | Exceptional 2.7% |
| Immigrants | Colombia | 98.4 /100 | #62 | Exceptional 2.7% |
| Indians (Asian) | 98.4 /100 | #63 | Exceptional 2.7% |
| Immigrants | Sri Lanka | 98.4 /100 | #64 | Exceptional 2.7% |
Demographics Similar to Nonimmigrants by Hearing Disability
In terms of hearing disability, the demographic groups most similar to Nonimmigrants are Basque (3.6%, a difference of 0.39%), Slovak (3.6%, a difference of 0.65%), Danish (3.6%, a difference of 0.70%), French American Indian (3.6%, a difference of 0.72%), and Scandinavian (3.6%, a difference of 0.78%).
| Demographics | Rating | Rank | Hearing Disability |
| Europeans | 0.1 /100 | #270 | Tragic 3.5% |
| Czechs | 0.1 /100 | #271 | Tragic 3.5% |
| Fijians | 0.0 /100 | #272 | Tragic 3.5% |
| Puerto Ricans | 0.0 /100 | #273 | Tragic 3.5% |
| Swiss | 0.0 /100 | #274 | Tragic 3.5% |
| Czechoslovakians | 0.0 /100 | #275 | Tragic 3.6% |
| Danes | 0.0 /100 | #276 | Tragic 3.6% |
| Immigrants | Nonimmigrants | 0.0 /100 | #277 | Tragic 3.6% |
| Basques | 0.0 /100 | #278 | Tragic 3.6% |
| Slovaks | 0.0 /100 | #279 | Tragic 3.6% |
| French American Indians | 0.0 /100 | #280 | Tragic 3.6% |
| Scandinavians | 0.0 /100 | #281 | Tragic 3.6% |
| Swedes | 0.0 /100 | #282 | Tragic 3.6% |
| Blackfeet | 0.0 /100 | #283 | Tragic 3.6% |
| Immigrants | Micronesia | 0.0 /100 | #284 | Tragic 3.6% |