Immigrants from Caribbean vs Bahamian Single Father Households
COMPARE
Immigrants from Caribbean
Bahamian
Single Father Households
Single Father Households Comparison
Immigrants from Caribbean
Bahamians
2.5%
SINGLE FATHER HOUSEHOLDS
1.0/ 100
METRIC RATING
260th/ 347
METRIC RANK
2.5%
SINGLE FATHER HOUSEHOLDS
2.4/ 100
METRIC RATING
248th/ 347
METRIC RANK
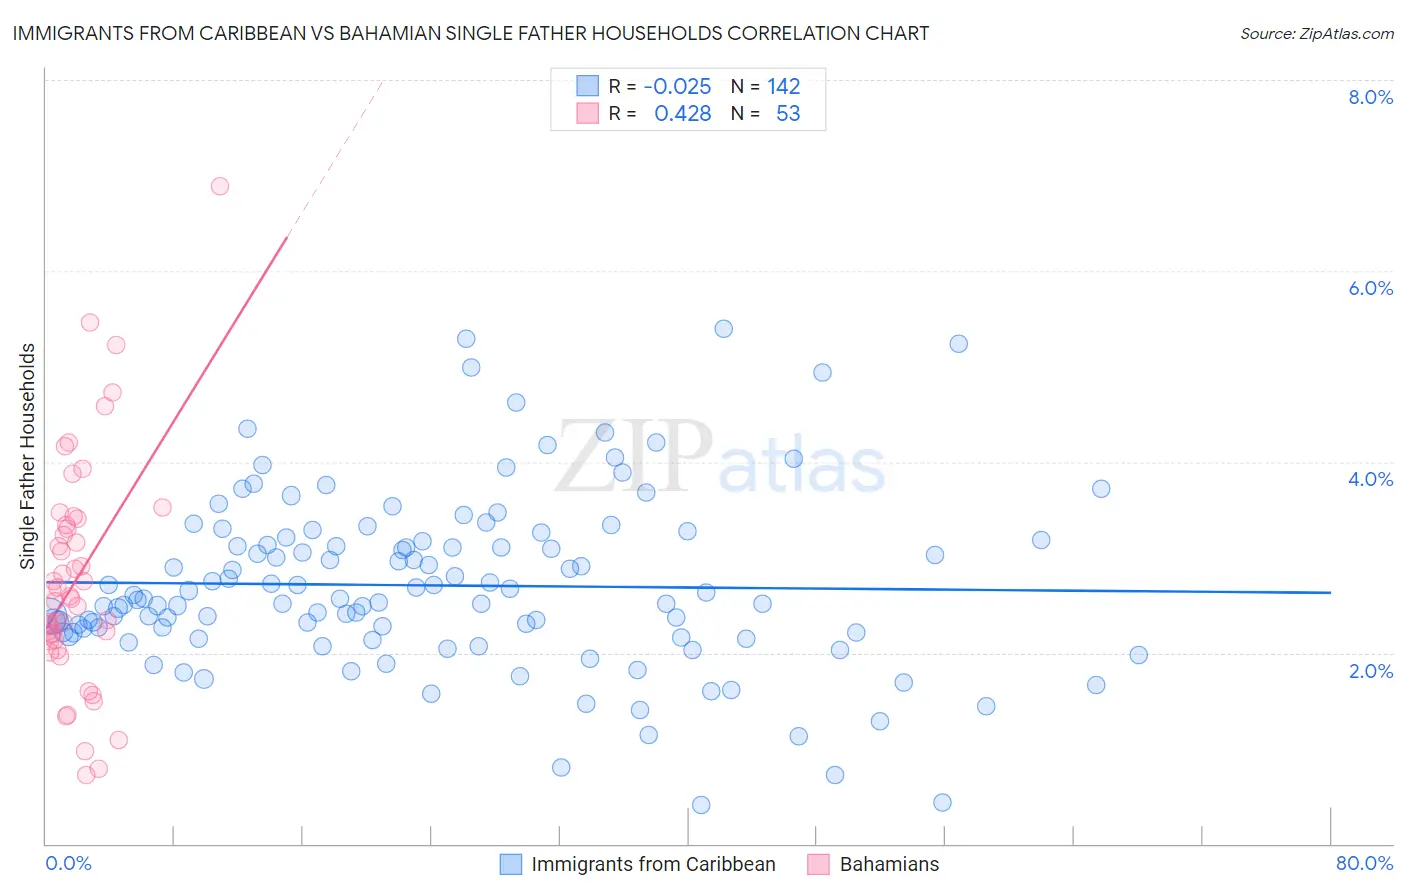
Immigrants from Caribbean vs Bahamian Single Father Households Correlation Chart
The statistical analysis conducted on geographies consisting of 444,658,168 people shows no correlation between the proportion of Immigrants from Caribbean and percentage of single father households in the United States with a correlation coefficient (R) of -0.025 and weighted average of 2.5%. Similarly, the statistical analysis conducted on geographies consisting of 112,214,100 people shows a moderate positive correlation between the proportion of Bahamians and percentage of single father households in the United States with a correlation coefficient (R) of 0.428 and weighted average of 2.5%, a difference of 1.6%.
Single Father Households Correlation Summary
| Measurement | Immigrants from Caribbean | Bahamian |
| Minimum | 0.41% | 0.72% |
| Maximum | 5.4% | 6.9% |
| Range | 5.0% | 6.2% |
| Mean | 2.7% | 2.8% |
| Median | 2.6% | 2.6% |
| Interquartile 25% (IQ1) | 2.2% | 2.1% |
| Interquartile 75% (IQ3) | 3.2% | 3.4% |
| Interquartile Range (IQR) | 0.95% | 1.2% |
| Standard Deviation (Sample) | 0.91% | 1.2% |
| Standard Deviation (Population) | 0.91% | 1.2% |
Demographics Similar to Immigrants from Caribbean and Bahamians by Single Father Households
In terms of single father households, the demographic groups most similar to Immigrants from Caribbean are Comanche (2.5%, a difference of 0.090%), Immigrants from Belize (2.5%, a difference of 0.16%), Spanish (2.5%, a difference of 0.24%), Immigrants from Liberia (2.5%, a difference of 0.31%), and Immigrants from Congo (2.5%, a difference of 0.33%). Similarly, the demographic groups most similar to Bahamians are Delaware (2.5%, a difference of 0.040%), Native Hawaiian (2.5%, a difference of 0.060%), Basque (2.5%, a difference of 0.080%), Immigrants from Cameroon (2.5%, a difference of 0.090%), and Somali (2.5%, a difference of 0.25%).
| Demographics | Rating | Rank | Single Father Households |
| Immigrants | Middle Africa | 2.8 /100 | #244 | Tragic 2.5% |
| Basques | 2.5 /100 | #245 | Tragic 2.5% |
| Native Hawaiians | 2.5 /100 | #246 | Tragic 2.5% |
| Delaware | 2.5 /100 | #247 | Tragic 2.5% |
| Bahamians | 2.4 /100 | #248 | Tragic 2.5% |
| Immigrants | Cameroon | 2.3 /100 | #249 | Tragic 2.5% |
| Somalis | 2.1 /100 | #250 | Tragic 2.5% |
| Liberians | 2.0 /100 | #251 | Tragic 2.5% |
| Immigrants | Eritrea | 2.0 /100 | #252 | Tragic 2.5% |
| Immigrants | Somalia | 1.9 /100 | #253 | Tragic 2.5% |
| Immigrants | Thailand | 1.8 /100 | #254 | Tragic 2.5% |
| Tongans | 1.5 /100 | #255 | Tragic 2.5% |
| Potawatomi | 1.4 /100 | #256 | Tragic 2.5% |
| Immigrants | Congo | 1.2 /100 | #257 | Tragic 2.5% |
| Spanish | 1.1 /100 | #258 | Tragic 2.5% |
| Comanche | 1.0 /100 | #259 | Tragic 2.5% |
| Immigrants | Caribbean | 1.0 /100 | #260 | Tragic 2.5% |
| Immigrants | Belize | 0.9 /100 | #261 | Tragic 2.5% |
| Immigrants | Liberia | 0.8 /100 | #262 | Tragic 2.5% |
| Dominicans | 0.8 /100 | #263 | Tragic 2.5% |
| Indonesians | 0.5 /100 | #264 | Tragic 2.6% |