Immigrants from Canada vs Laotian Unemployment Among Ages 20 to 24 years
COMPARE
Immigrants from Canada
Laotian
Unemployment Among Ages 20 to 24 years
Unemployment Among Ages 20 to 24 years Comparison
Immigrants from Canada
Laotians
10.1%
UNEMPLOYMENT AMONG AGES 20 TO 24 YEARS
88.2/ 100
METRIC RATING
120th/ 347
METRIC RANK
10.0%
UNEMPLOYMENT AMONG AGES 20 TO 24 YEARS
95.1/ 100
METRIC RATING
101st/ 347
METRIC RANK
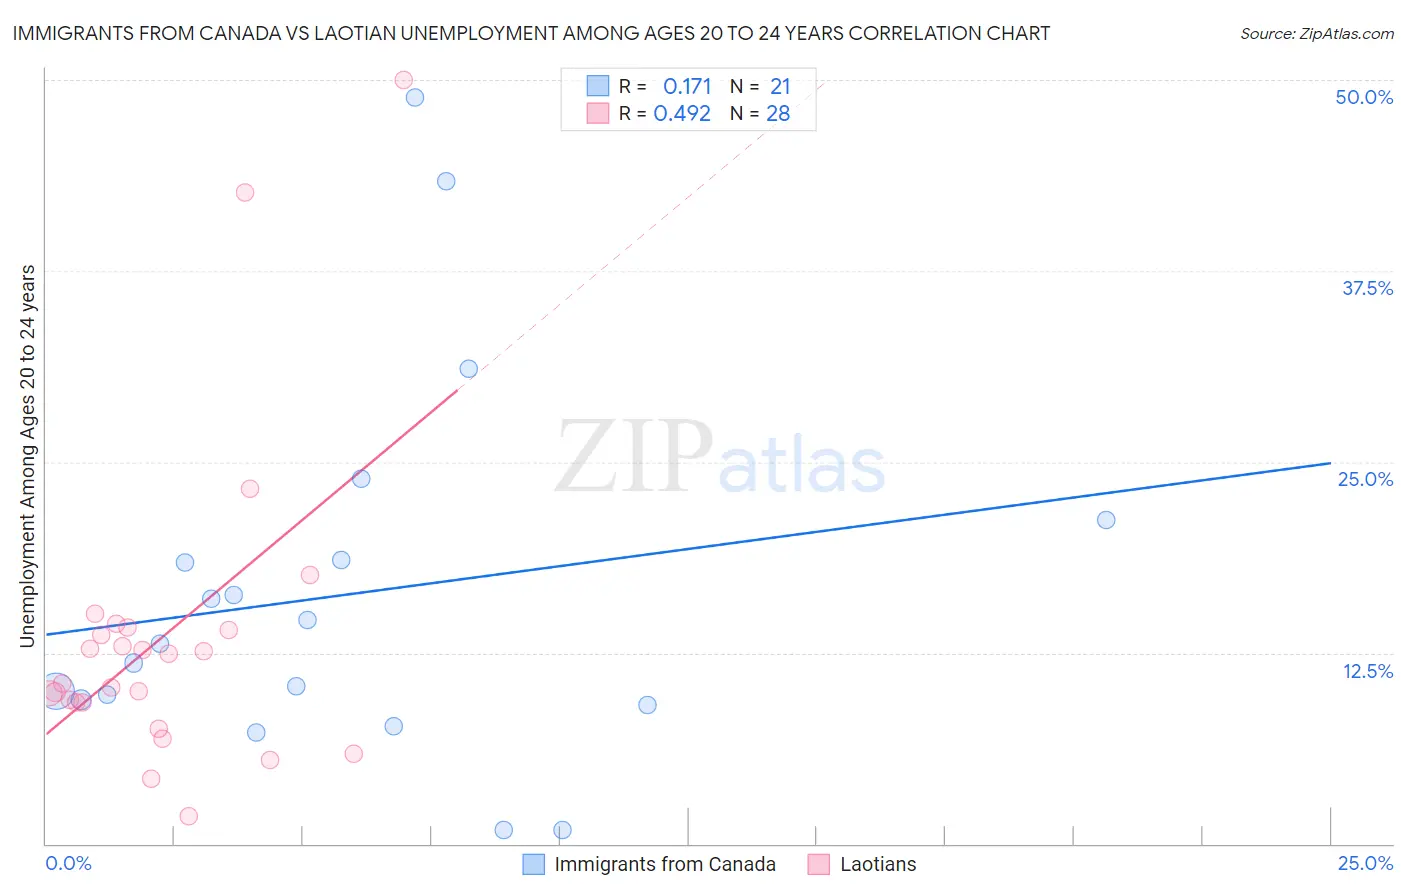
Immigrants from Canada vs Laotian Unemployment Among Ages 20 to 24 years Correlation Chart
The statistical analysis conducted on geographies consisting of 438,067,925 people shows a poor positive correlation between the proportion of Immigrants from Canada and unemployment rate among population between the ages 20 and 24 in the United States with a correlation coefficient (R) of 0.171 and weighted average of 10.1%. Similarly, the statistical analysis conducted on geographies consisting of 222,318,463 people shows a moderate positive correlation between the proportion of Laotians and unemployment rate among population between the ages 20 and 24 in the United States with a correlation coefficient (R) of 0.492 and weighted average of 10.0%, a difference of 0.90%.
Unemployment Among Ages 20 to 24 years Correlation Summary
| Measurement | Immigrants from Canada | Laotian |
| Minimum | 0.90% | 1.8% |
| Maximum | 48.8% | 50.0% |
| Range | 47.9% | 48.2% |
| Mean | 16.3% | 13.5% |
| Median | 13.1% | 11.5% |
| Interquartile 25% (IQ1) | 9.3% | 9.2% |
| Interquartile 75% (IQ3) | 19.9% | 14.1% |
| Interquartile Range (IQR) | 10.6% | 4.8% |
| Standard Deviation (Sample) | 12.2% | 10.2% |
| Standard Deviation (Population) | 11.9% | 10.1% |
Demographics Similar to Immigrants from Canada and Laotians by Unemployment Among Ages 20 to 24 years
In terms of unemployment among ages 20 to 24 years, the demographic groups most similar to Immigrants from Canada are French (10.1%, a difference of 0.0%), Paraguayan (10.1%, a difference of 0.040%), Immigrants from Uruguay (10.1%, a difference of 0.13%), Basque (10.1%, a difference of 0.15%), and Immigrants from Morocco (10.1%, a difference of 0.22%). Similarly, the demographic groups most similar to Laotians are Immigrants from France (10.0%, a difference of 0.030%), Immigrants from Argentina (10.0%, a difference of 0.050%), Irish (10.0%, a difference of 0.16%), Immigrants from Chile (10.0%, a difference of 0.19%), and Immigrants from Hungary (10.0%, a difference of 0.21%).
| Demographics | Rating | Rank | Unemployment Among Ages 20 to 24 years |
| Immigrants | France | 95.2 /100 | #100 | Exceptional 10.0% |
| Laotians | 95.1 /100 | #101 | Exceptional 10.0% |
| Immigrants | Argentina | 94.9 /100 | #102 | Exceptional 10.0% |
| Irish | 94.3 /100 | #103 | Exceptional 10.0% |
| Immigrants | Chile | 94.0 /100 | #104 | Exceptional 10.0% |
| Immigrants | Hungary | 94.0 /100 | #105 | Exceptional 10.0% |
| Pennsylvania Germans | 93.9 /100 | #106 | Exceptional 10.0% |
| Iroquois | 93.4 /100 | #107 | Exceptional 10.1% |
| Immigrants | Latvia | 93.2 /100 | #108 | Exceptional 10.1% |
| Filipinos | 93.2 /100 | #109 | Exceptional 10.1% |
| Immigrants | Spain | 93.1 /100 | #110 | Exceptional 10.1% |
| Immigrants | Indonesia | 92.7 /100 | #111 | Exceptional 10.1% |
| Northern Europeans | 92.7 /100 | #112 | Exceptional 10.1% |
| German Russians | 92.4 /100 | #113 | Exceptional 10.1% |
| Ottawa | 90.8 /100 | #114 | Exceptional 10.1% |
| Immigrants | Morocco | 90.5 /100 | #115 | Exceptional 10.1% |
| Basques | 89.8 /100 | #116 | Excellent 10.1% |
| Immigrants | Uruguay | 89.6 /100 | #117 | Excellent 10.1% |
| Paraguayans | 88.6 /100 | #118 | Excellent 10.1% |
| French | 88.2 /100 | #119 | Excellent 10.1% |
| Immigrants | Canada | 88.2 /100 | #120 | Excellent 10.1% |