Immigrants from Barbados vs Laotian Disability Age Under 5
COMPARE
Immigrants from Barbados
Laotian
Disability Age Under 5
Disability Age Under 5 Comparison
Immigrants from Barbados
Laotians
0.97%
DISABILITY AGE UNDER 5
100.0/ 100
METRIC RATING
18th/ 347
METRIC RANK
1.2%
DISABILITY AGE UNDER 5
62.8/ 100
METRIC RATING
164th/ 347
METRIC RANK
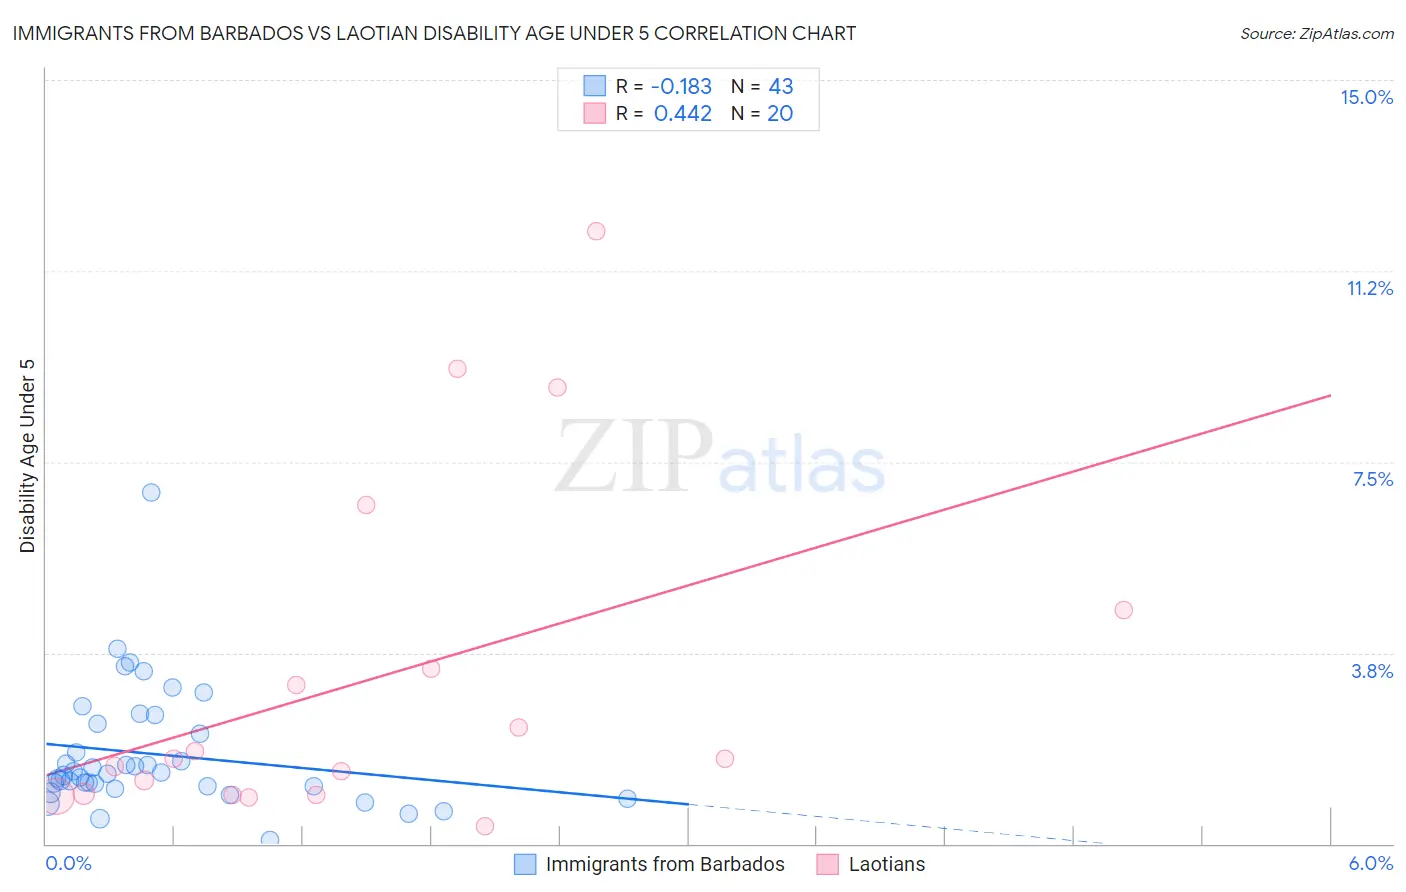
Immigrants from Barbados vs Laotian Disability Age Under 5 Correlation Chart
The statistical analysis conducted on geographies consisting of 80,516,356 people shows a poor negative correlation between the proportion of Immigrants from Barbados and percentage of population with a disability under the age of 5 in the United States with a correlation coefficient (R) of -0.183 and weighted average of 0.97%. Similarly, the statistical analysis conducted on geographies consisting of 148,180,930 people shows a moderate positive correlation between the proportion of Laotians and percentage of population with a disability under the age of 5 in the United States with a correlation coefficient (R) of 0.442 and weighted average of 1.2%, a difference of 26.5%.
Disability Age Under 5 Correlation Summary
| Measurement | Immigrants from Barbados | Laotian |
| Minimum | 0.086% | 0.35% |
| Maximum | 6.9% | 12.0% |
| Range | 6.8% | 11.7% |
| Mean | 1.8% | 3.2% |
| Median | 1.4% | 1.7% |
| Interquartile 25% (IQ1) | 1.1% | 0.97% |
| Interquartile 75% (IQ3) | 2.4% | 4.0% |
| Interquartile Range (IQR) | 1.2% | 3.0% |
| Standard Deviation (Sample) | 1.2% | 3.4% |
| Standard Deviation (Population) | 1.2% | 3.3% |
Similar Demographics by Disability Age Under 5
Demographics Similar to Immigrants from Barbados by Disability Age Under 5
In terms of disability age under 5, the demographic groups most similar to Immigrants from Barbados are Puget Sound Salish (0.97%, a difference of 0.37%), Nepalese (0.97%, a difference of 0.47%), Immigrants from China (0.96%, a difference of 0.58%), Immigrants from Israel (0.96%, a difference of 1.0%), and Immigrants from Hong Kong (0.95%, a difference of 2.3%).
| Demographics | Rating | Rank | Disability Age Under 5 |
| Afghans | 100.0 /100 | #11 | Exceptional 0.94% |
| Immigrants | Grenada | 100.0 /100 | #12 | Exceptional 0.94% |
| Soviet Union | 100.0 /100 | #13 | Exceptional 0.95% |
| Yuman | 100.0 /100 | #14 | Exceptional 0.95% |
| Immigrants | Hong Kong | 100.0 /100 | #15 | Exceptional 0.95% |
| Immigrants | Israel | 100.0 /100 | #16 | Exceptional 0.96% |
| Immigrants | China | 100.0 /100 | #17 | Exceptional 0.96% |
| Immigrants | Barbados | 100.0 /100 | #18 | Exceptional 0.97% |
| Puget Sound Salish | 100.0 /100 | #19 | Exceptional 0.97% |
| Nepalese | 100.0 /100 | #20 | Exceptional 0.97% |
| British West Indians | 100.0 /100 | #21 | Exceptional 0.99% |
| Immigrants | Iran | 100.0 /100 | #22 | Exceptional 1.00% |
| Yakama | 100.0 /100 | #23 | Exceptional 1.00% |
| Indians (Asian) | 100.0 /100 | #24 | Exceptional 1.0% |
| Immigrants | Micronesia | 100.0 /100 | #25 | Exceptional 1.0% |
Demographics Similar to Laotians by Disability Age Under 5
In terms of disability age under 5, the demographic groups most similar to Laotians are Immigrants from Kuwait (1.2%, a difference of 0.020%), Immigrants from Guatemala (1.2%, a difference of 0.050%), Guatemalan (1.2%, a difference of 0.080%), Immigrants from Central America (1.2%, a difference of 0.13%), and Immigrants from Africa (1.2%, a difference of 0.23%).
| Demographics | Rating | Rank | Disability Age Under 5 |
| Immigrants | South America | 67.0 /100 | #157 | Good 1.2% |
| Arabs | 66.4 /100 | #158 | Good 1.2% |
| Colombians | 65.8 /100 | #159 | Good 1.2% |
| Immigrants | Latin America | 65.8 /100 | #160 | Good 1.2% |
| Immigrants | Africa | 65.1 /100 | #161 | Good 1.2% |
| Guatemalans | 63.6 /100 | #162 | Good 1.2% |
| Immigrants | Guatemala | 63.2 /100 | #163 | Good 1.2% |
| Laotians | 62.8 /100 | #164 | Good 1.2% |
| Immigrants | Kuwait | 62.6 /100 | #165 | Good 1.2% |
| Immigrants | Central America | 61.4 /100 | #166 | Good 1.2% |
| Immigrants | Argentina | 60.2 /100 | #167 | Good 1.2% |
| Sierra Leoneans | 59.1 /100 | #168 | Average 1.2% |
| Immigrants | Uruguay | 59.0 /100 | #169 | Average 1.2% |
| Immigrants | Jamaica | 58.8 /100 | #170 | Average 1.2% |
| Guamanians/Chamorros | 57.8 /100 | #171 | Average 1.2% |