Immigrants from Cameroon vs Immigrants from Iraq 1st Grade
COMPARE
Immigrants from Cameroon
Immigrants from Iraq
1st Grade
1st Grade Comparison
Immigrants from Cameroon
Immigrants from Iraq
97.4%
1ST GRADE
0.2/ 100
METRIC RATING
271st/ 347
METRIC RANK
97.6%
1ST GRADE
0.9/ 100
METRIC RATING
251st/ 347
METRIC RANK
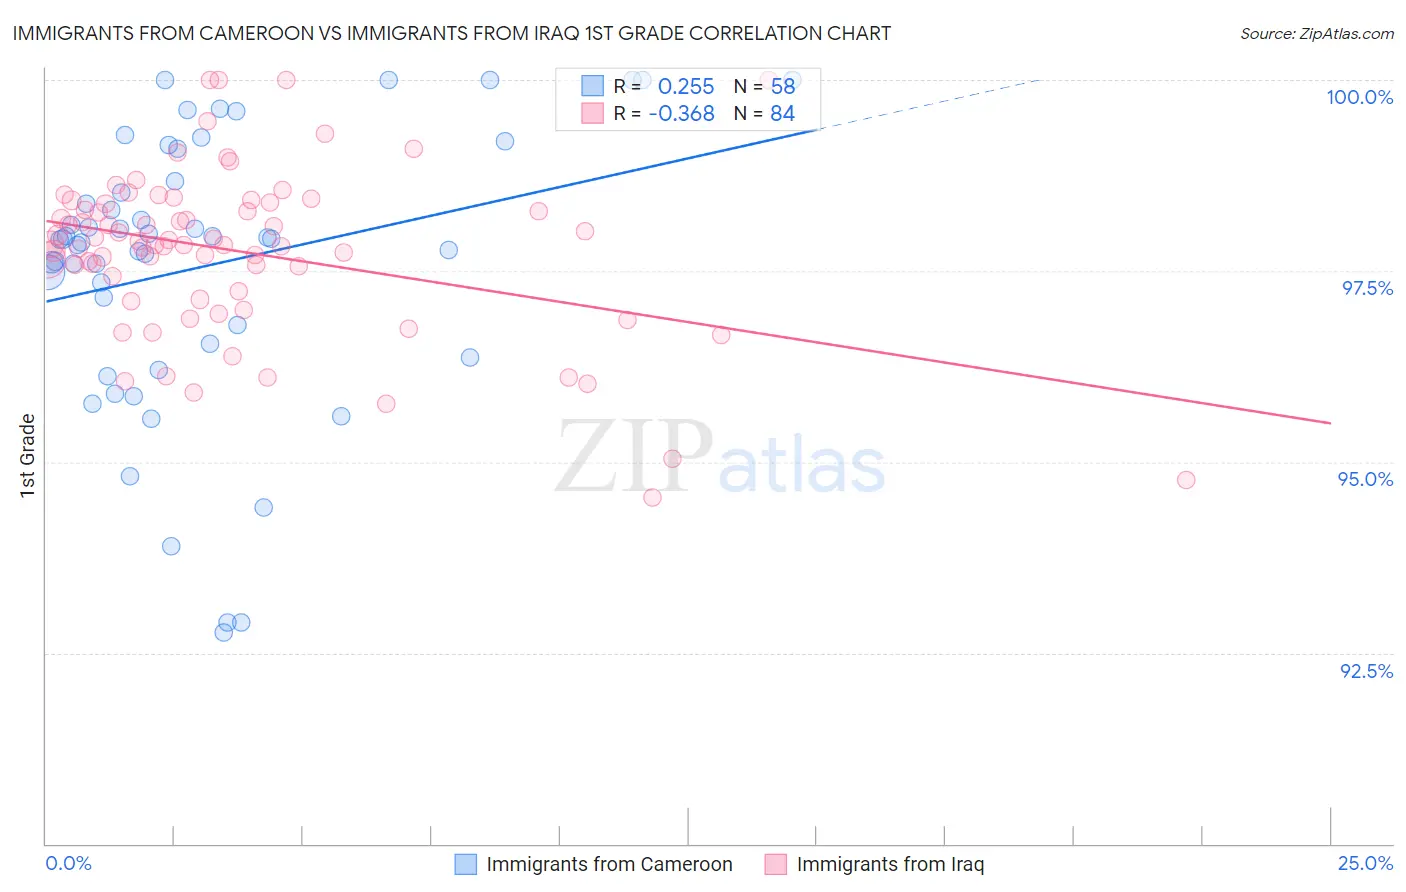
Immigrants from Cameroon vs Immigrants from Iraq 1st Grade Correlation Chart
The statistical analysis conducted on geographies consisting of 130,752,798 people shows a weak positive correlation between the proportion of Immigrants from Cameroon and percentage of population with at least 1st grade education in the United States with a correlation coefficient (R) of 0.255 and weighted average of 97.4%. Similarly, the statistical analysis conducted on geographies consisting of 194,726,982 people shows a mild negative correlation between the proportion of Immigrants from Iraq and percentage of population with at least 1st grade education in the United States with a correlation coefficient (R) of -0.368 and weighted average of 97.6%, a difference of 0.12%.
1st Grade Correlation Summary
| Measurement | Immigrants from Cameroon | Immigrants from Iraq |
| Minimum | 92.8% | 94.5% |
| Maximum | 100.0% | 100.0% |
| Range | 7.2% | 5.5% |
| Mean | 97.6% | 97.8% |
| Median | 97.9% | 97.8% |
| Interquartile 25% (IQ1) | 96.6% | 97.2% |
| Interquartile 75% (IQ3) | 98.7% | 98.4% |
| Interquartile Range (IQR) | 2.1% | 1.2% |
| Standard Deviation (Sample) | 1.8% | 1.1% |
| Standard Deviation (Population) | 1.8% | 1.1% |
Demographics Similar to Immigrants from Cameroon and Immigrants from Iraq by 1st Grade
In terms of 1st grade, the demographic groups most similar to Immigrants from Cameroon are Immigrants from Jamaica (97.5%, a difference of 0.020%), West Indian (97.5%, a difference of 0.030%), Immigrants from Nigeria (97.5%, a difference of 0.040%), Cuban (97.5%, a difference of 0.050%), and Immigrants from Liberia (97.5%, a difference of 0.050%). Similarly, the demographic groups most similar to Immigrants from Iraq are Immigrants from Africa (97.6%, a difference of 0.0%), Immigrants from Congo (97.5%, a difference of 0.020%), Immigrants from Asia (97.5%, a difference of 0.020%), Immigrants from Colombia (97.5%, a difference of 0.030%), and Jamaican (97.5%, a difference of 0.030%).
| Demographics | Rating | Rank | 1st Grade |
| Immigrants | Iraq | 0.9 /100 | #251 | Tragic 97.6% |
| Immigrants | Africa | 0.9 /100 | #252 | Tragic 97.6% |
| Immigrants | Congo | 0.7 /100 | #253 | Tragic 97.5% |
| Immigrants | Asia | 0.7 /100 | #254 | Tragic 97.5% |
| Immigrants | Colombia | 0.6 /100 | #255 | Tragic 97.5% |
| Jamaicans | 0.6 /100 | #256 | Tragic 97.5% |
| Yaqui | 0.6 /100 | #257 | Tragic 97.5% |
| Indians (Asian) | 0.6 /100 | #258 | Tragic 97.5% |
| Fijians | 0.5 /100 | #259 | Tragic 97.5% |
| Armenians | 0.5 /100 | #260 | Tragic 97.5% |
| Immigrants | Ethiopia | 0.4 /100 | #261 | Tragic 97.5% |
| Assyrians/Chaldeans/Syriacs | 0.4 /100 | #262 | Tragic 97.5% |
| Immigrants | South America | 0.4 /100 | #263 | Tragic 97.5% |
| Taiwanese | 0.4 /100 | #264 | Tragic 97.5% |
| Cubans | 0.3 /100 | #265 | Tragic 97.5% |
| Immigrants | Liberia | 0.3 /100 | #266 | Tragic 97.5% |
| Immigrants | Sierra Leone | 0.3 /100 | #267 | Tragic 97.5% |
| Immigrants | Nigeria | 0.3 /100 | #268 | Tragic 97.5% |
| West Indians | 0.3 /100 | #269 | Tragic 97.5% |
| Immigrants | Jamaica | 0.2 /100 | #270 | Tragic 97.5% |
| Immigrants | Cameroon | 0.2 /100 | #271 | Tragic 97.4% |