Immigrants from Cameroon vs Chilean 8th Grade
COMPARE
Immigrants from Cameroon
Chilean
8th Grade
8th Grade Comparison
Immigrants from Cameroon
Chileans
95.0%
8TH GRADE
0.8/ 100
METRIC RATING
254th/ 347
METRIC RANK
95.7%
8TH GRADE
50.0/ 100
METRIC RATING
174th/ 347
METRIC RANK
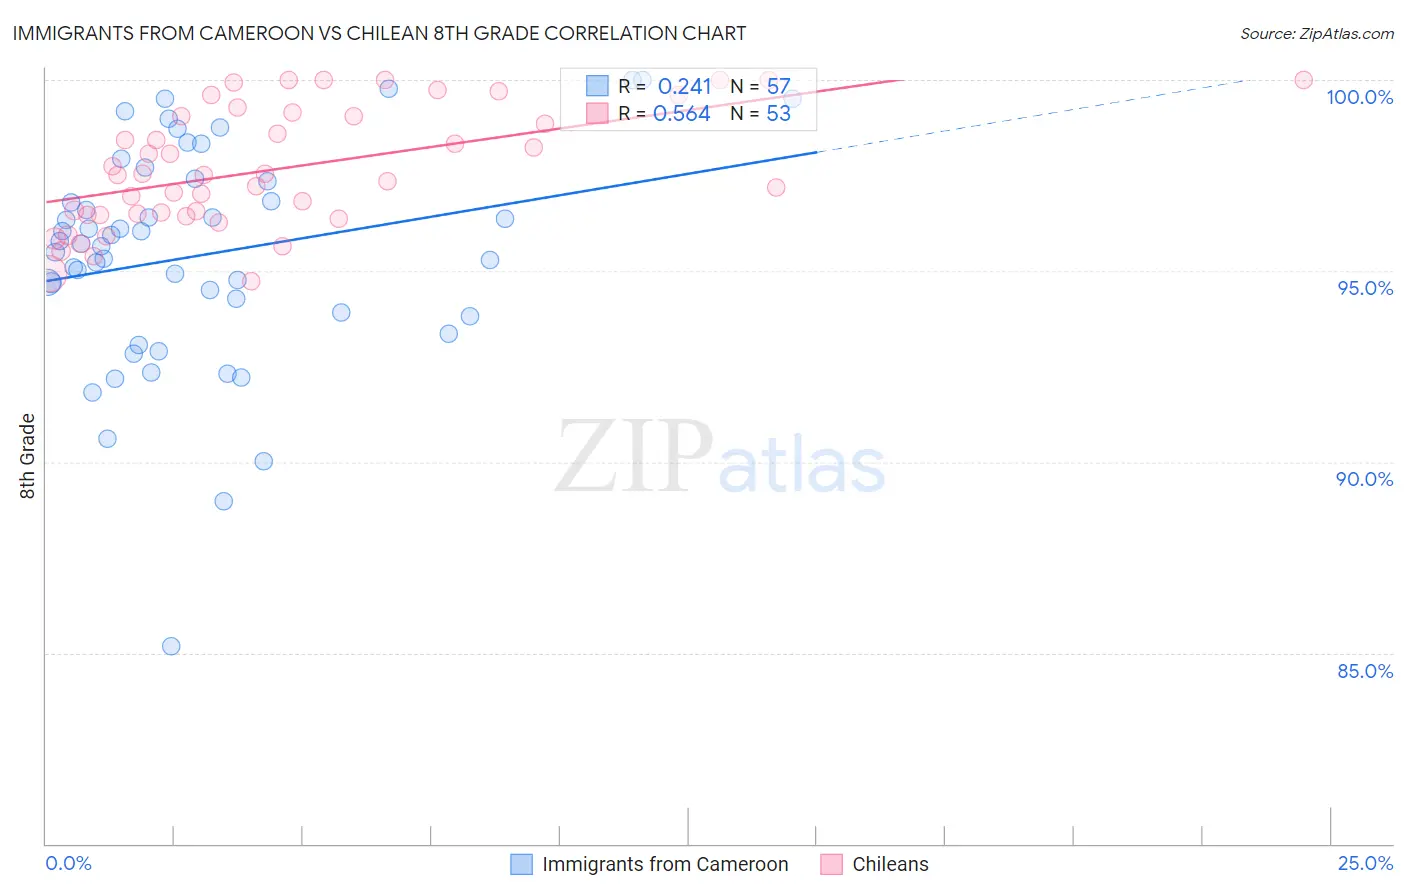
Immigrants from Cameroon vs Chilean 8th Grade Correlation Chart
The statistical analysis conducted on geographies consisting of 130,618,704 people shows a weak positive correlation between the proportion of Immigrants from Cameroon and percentage of population with at least 8th grade education in the United States with a correlation coefficient (R) of 0.241 and weighted average of 95.0%. Similarly, the statistical analysis conducted on geographies consisting of 256,681,007 people shows a substantial positive correlation between the proportion of Chileans and percentage of population with at least 8th grade education in the United States with a correlation coefficient (R) of 0.564 and weighted average of 95.7%, a difference of 0.78%.
8th Grade Correlation Summary
| Measurement | Immigrants from Cameroon | Chilean |
| Minimum | 85.2% | 94.7% |
| Maximum | 100.0% | 100.0% |
| Range | 14.8% | 5.3% |
| Mean | 95.4% | 97.7% |
| Median | 95.7% | 97.5% |
| Interquartile 25% (IQ1) | 93.9% | 96.5% |
| Interquartile 75% (IQ3) | 97.4% | 99.1% |
| Interquartile Range (IQR) | 3.5% | 2.6% |
| Standard Deviation (Sample) | 2.9% | 1.6% |
| Standard Deviation (Population) | 2.9% | 1.5% |
Similar Demographics by 8th Grade
Demographics Similar to Immigrants from Cameroon by 8th Grade
In terms of 8th grade, the demographic groups most similar to Immigrants from Cameroon are U.S. Virgin Islander (95.0%, a difference of 0.020%), Immigrants from Somalia (95.0%, a difference of 0.020%), Bolivian (95.0%, a difference of 0.030%), Immigrants from Ethiopia (95.0%, a difference of 0.030%), and Colombian (95.0%, a difference of 0.030%).
| Demographics | Rating | Rank | 8th Grade |
| Immigrants | Senegal | 1.4 /100 | #247 | Tragic 95.1% |
| Uruguayans | 1.2 /100 | #248 | Tragic 95.1% |
| Immigrants | China | 1.1 /100 | #249 | Tragic 95.0% |
| Koreans | 1.1 /100 | #250 | Tragic 95.0% |
| Bolivians | 1.0 /100 | #251 | Tragic 95.0% |
| Immigrants | Ethiopia | 1.0 /100 | #252 | Tragic 95.0% |
| U.S. Virgin Islanders | 0.9 /100 | #253 | Tragic 95.0% |
| Immigrants | Cameroon | 0.8 /100 | #254 | Tragic 95.0% |
| Immigrants | Somalia | 0.7 /100 | #255 | Tragic 95.0% |
| Colombians | 0.7 /100 | #256 | Tragic 95.0% |
| Afghans | 0.6 /100 | #257 | Tragic 94.9% |
| Immigrants | Congo | 0.6 /100 | #258 | Tragic 94.9% |
| Ghanaians | 0.6 /100 | #259 | Tragic 94.9% |
| Immigrants | Jamaica | 0.6 /100 | #260 | Tragic 94.9% |
| Immigrants | Costa Rica | 0.5 /100 | #261 | Tragic 94.9% |
Demographics Similar to Chileans by 8th Grade
In terms of 8th grade, the demographic groups most similar to Chileans are Immigrants from Albania (95.7%, a difference of 0.0%), Pakistani (95.7%, a difference of 0.010%), Mongolian (95.8%, a difference of 0.020%), Marshallese (95.7%, a difference of 0.020%), and Venezuelan (95.7%, a difference of 0.020%).
| Demographics | Rating | Rank | 8th Grade |
| Spaniards | 60.0 /100 | #167 | Good 95.8% |
| Immigrants | Ukraine | 59.5 /100 | #168 | Average 95.8% |
| Immigrants | Iran | 58.6 /100 | #169 | Average 95.8% |
| Ute | 58.5 /100 | #170 | Average 95.8% |
| Egyptians | 58.2 /100 | #171 | Average 95.8% |
| Immigrants | Korea | 57.9 /100 | #172 | Average 95.8% |
| Mongolians | 53.0 /100 | #173 | Average 95.8% |
| Chileans | 50.0 /100 | #174 | Average 95.7% |
| Immigrants | Albania | 49.6 /100 | #175 | Average 95.7% |
| Pakistanis | 48.8 /100 | #176 | Average 95.7% |
| Marshallese | 47.6 /100 | #177 | Average 95.7% |
| Venezuelans | 47.5 /100 | #178 | Average 95.7% |
| Immigrants | Brazil | 45.4 /100 | #179 | Average 95.7% |
| Iraqis | 40.5 /100 | #180 | Average 95.7% |
| Immigrants | Spain | 38.7 /100 | #181 | Fair 95.7% |