Immigrants from Venezuela vs Paraguayan Disability Age 65 to 74
COMPARE
Immigrants from Venezuela
Paraguayan
Disability Age 65 to 74
Disability Age 65 to 74 Comparison
Immigrants from Venezuela
Paraguayans
21.8%
DISABILITY AGE 65 TO 74
99.0/ 100
METRIC RATING
73rd/ 347
METRIC RANK
20.5%
DISABILITY AGE 65 TO 74
100.0/ 100
METRIC RATING
15th/ 347
METRIC RANK
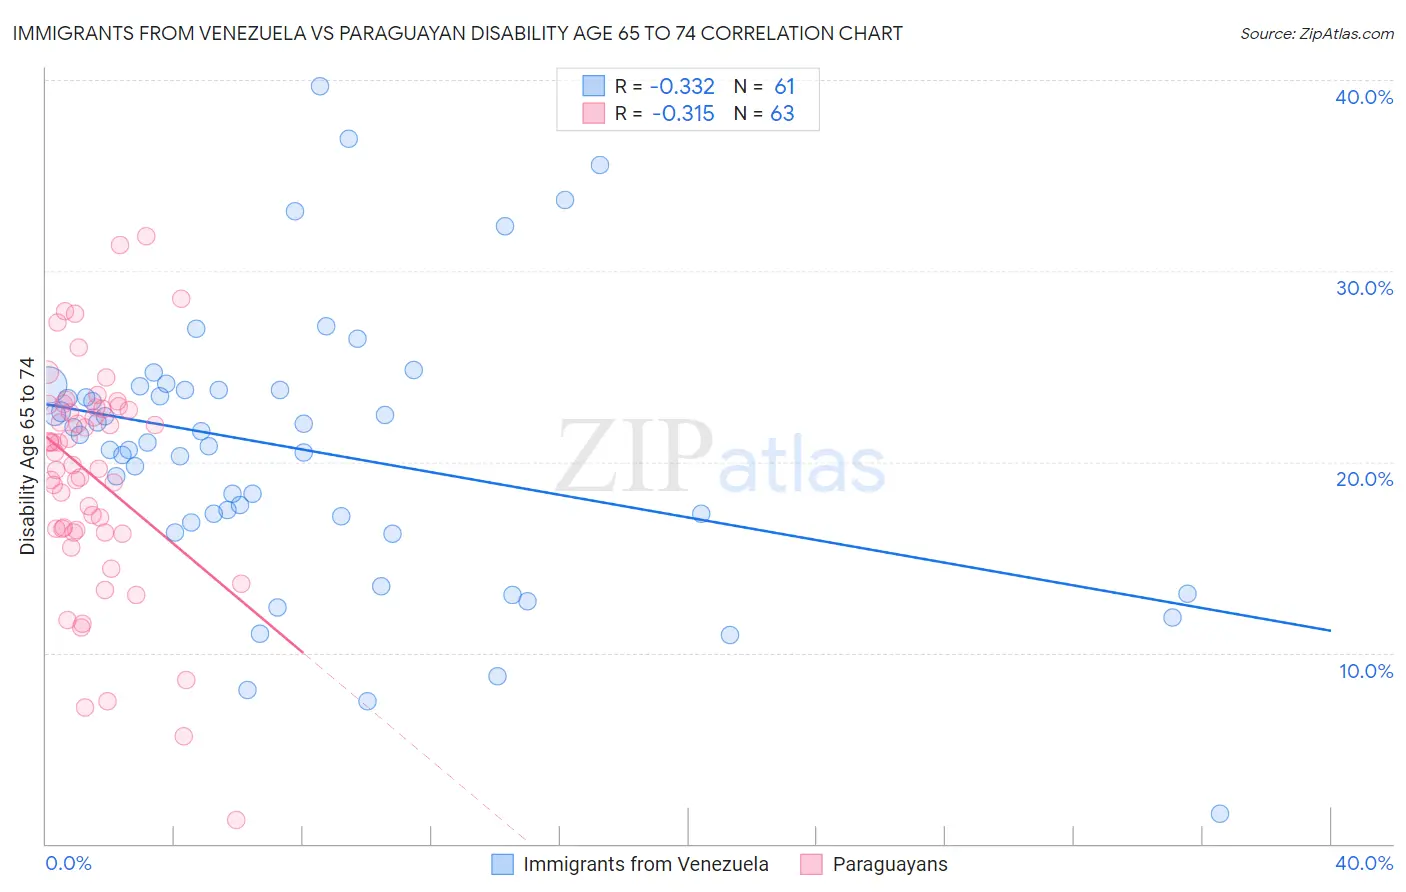
Immigrants from Venezuela vs Paraguayan Disability Age 65 to 74 Correlation Chart
The statistical analysis conducted on geographies consisting of 287,548,772 people shows a mild negative correlation between the proportion of Immigrants from Venezuela and percentage of population with a disability between the ages 65 and 75 in the United States with a correlation coefficient (R) of -0.332 and weighted average of 21.8%. Similarly, the statistical analysis conducted on geographies consisting of 95,081,049 people shows a mild negative correlation between the proportion of Paraguayans and percentage of population with a disability between the ages 65 and 75 in the United States with a correlation coefficient (R) of -0.315 and weighted average of 20.5%, a difference of 5.9%.
Disability Age 65 to 74 Correlation Summary
| Measurement | Immigrants from Venezuela | Paraguayan |
| Minimum | 1.6% | 1.2% |
| Maximum | 39.7% | 31.8% |
| Range | 38.1% | 30.6% |
| Mean | 20.6% | 19.2% |
| Median | 21.0% | 19.8% |
| Interquartile 25% (IQ1) | 17.0% | 16.3% |
| Interquartile 75% (IQ3) | 23.8% | 22.9% |
| Interquartile Range (IQR) | 6.8% | 6.5% |
| Standard Deviation (Sample) | 7.2% | 6.0% |
| Standard Deviation (Population) | 7.1% | 5.9% |
Similar Demographics by Disability Age 65 to 74
Demographics Similar to Immigrants from Venezuela by Disability Age 65 to 74
In terms of disability age 65 to 74, the demographic groups most similar to Immigrants from Venezuela are Cambodian (21.8%, a difference of 0.010%), Mongolian (21.8%, a difference of 0.030%), Greek (21.8%, a difference of 0.040%), Immigrants from Poland (21.8%, a difference of 0.090%), and Immigrants from Eastern Europe (21.8%, a difference of 0.15%).
| Demographics | Rating | Rank | Disability Age 65 to 74 |
| Maltese | 99.4 /100 | #66 | Exceptional 21.6% |
| Immigrants | South Africa | 99.3 /100 | #67 | Exceptional 21.7% |
| Immigrants | Scotland | 99.3 /100 | #68 | Exceptional 21.7% |
| Immigrants | Egypt | 99.2 /100 | #69 | Exceptional 21.7% |
| Chinese | 99.2 /100 | #70 | Exceptional 21.7% |
| Immigrants | Belarus | 99.2 /100 | #71 | Exceptional 21.7% |
| Immigrants | Hungary | 99.2 /100 | #72 | Exceptional 21.7% |
| Immigrants | Venezuela | 99.0 /100 | #73 | Exceptional 21.8% |
| Cambodians | 99.0 /100 | #74 | Exceptional 21.8% |
| Mongolians | 99.0 /100 | #75 | Exceptional 21.8% |
| Greeks | 99.0 /100 | #76 | Exceptional 21.8% |
| Immigrants | Poland | 99.0 /100 | #77 | Exceptional 21.8% |
| Immigrants | Eastern Europe | 99.0 /100 | #78 | Exceptional 21.8% |
| Venezuelans | 99.0 /100 | #79 | Exceptional 21.8% |
| Immigrants | Norway | 98.9 /100 | #80 | Exceptional 21.8% |
Demographics Similar to Paraguayans by Disability Age 65 to 74
In terms of disability age 65 to 74, the demographic groups most similar to Paraguayans are Indian (Asian) (20.5%, a difference of 0.020%), Immigrants from Lithuania (20.5%, a difference of 0.060%), Immigrants from South Central Asia (20.6%, a difference of 0.31%), Eastern European (20.6%, a difference of 0.38%), and Burmese (20.6%, a difference of 0.41%).
| Demographics | Rating | Rank | Disability Age 65 to 74 |
| Thais | 100.0 /100 | #8 | Exceptional 20.1% |
| Immigrants | China | 100.0 /100 | #9 | Exceptional 20.3% |
| Immigrants | Eastern Asia | 100.0 /100 | #10 | Exceptional 20.3% |
| Immigrants | Ireland | 100.0 /100 | #11 | Exceptional 20.3% |
| Immigrants | Korea | 100.0 /100 | #12 | Exceptional 20.4% |
| Immigrants | Singapore | 100.0 /100 | #13 | Exceptional 20.4% |
| Indians (Asian) | 100.0 /100 | #14 | Exceptional 20.5% |
| Paraguayans | 100.0 /100 | #15 | Exceptional 20.5% |
| Immigrants | Lithuania | 100.0 /100 | #16 | Exceptional 20.5% |
| Immigrants | South Central Asia | 100.0 /100 | #17 | Exceptional 20.6% |
| Eastern Europeans | 100.0 /100 | #18 | Exceptional 20.6% |
| Burmese | 100.0 /100 | #19 | Exceptional 20.6% |
| Okinawans | 100.0 /100 | #20 | Exceptional 20.7% |
| Immigrants | Bolivia | 99.9 /100 | #21 | Exceptional 20.8% |
| Immigrants | Iran | 99.9 /100 | #22 | Exceptional 20.9% |