Hungarian vs Norwegian Disability Age 65 to 74
COMPARE
Hungarian
Norwegian
Disability Age 65 to 74
Disability Age 65 to 74 Comparison
Hungarians
Norwegians
22.4%
DISABILITY AGE 65 TO 74
93.3/ 100
METRIC RATING
123rd/ 347
METRIC RANK
22.5%
DISABILITY AGE 65 TO 74
92.5/ 100
METRIC RATING
124th/ 347
METRIC RANK
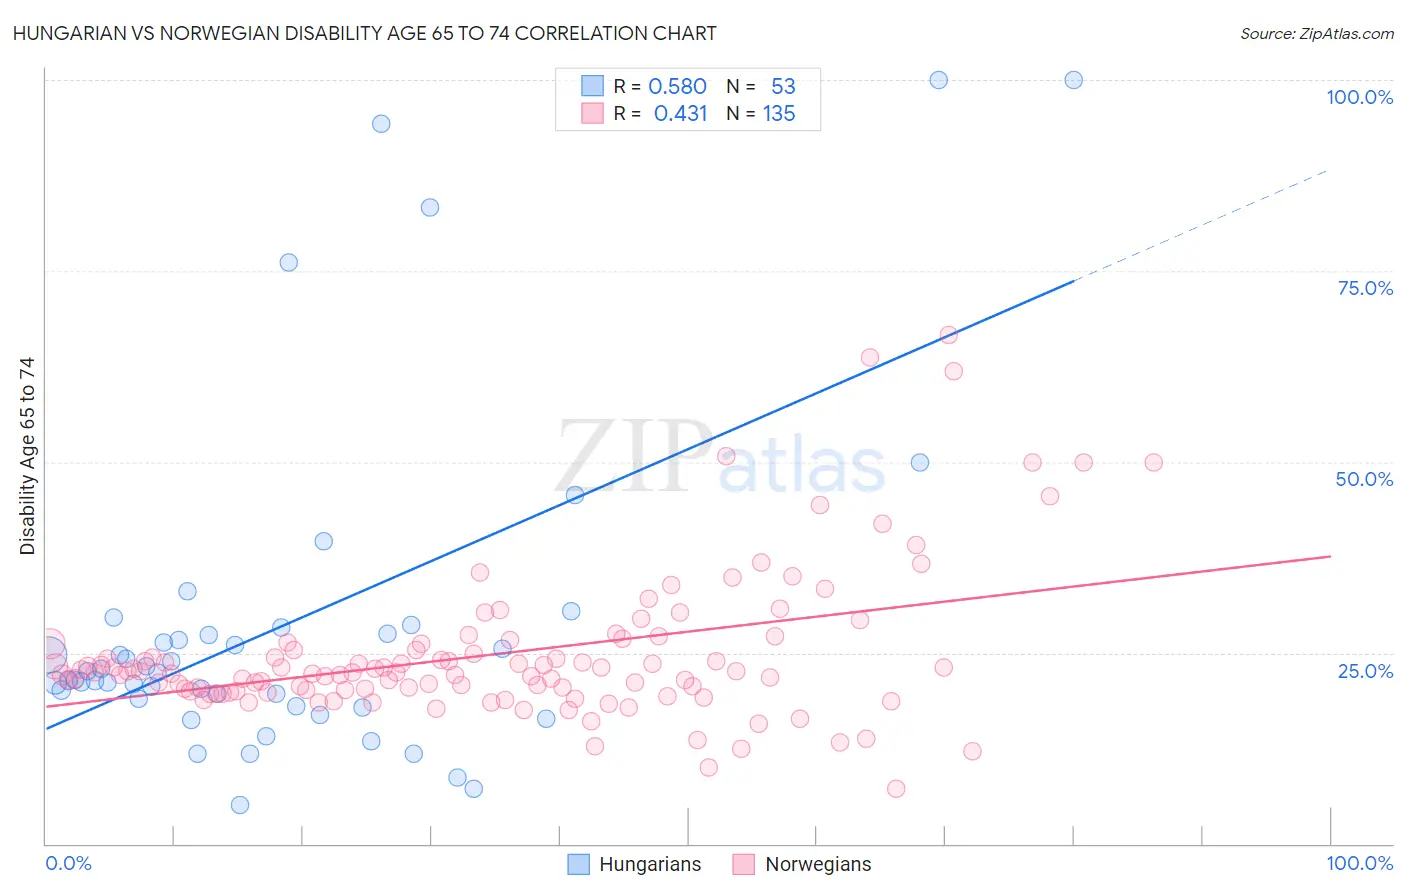
Hungarian vs Norwegian Disability Age 65 to 74 Correlation Chart
The statistical analysis conducted on geographies consisting of 484,991,296 people shows a substantial positive correlation between the proportion of Hungarians and percentage of population with a disability between the ages 65 and 75 in the United States with a correlation coefficient (R) of 0.580 and weighted average of 22.4%. Similarly, the statistical analysis conducted on geographies consisting of 531,492,634 people shows a moderate positive correlation between the proportion of Norwegians and percentage of population with a disability between the ages 65 and 75 in the United States with a correlation coefficient (R) of 0.431 and weighted average of 22.5%, a difference of 0.19%.
Disability Age 65 to 74 Correlation Summary
| Measurement | Hungarian | Norwegian |
| Minimum | 5.1% | 7.1% |
| Maximum | 100.0% | 66.7% |
| Range | 94.9% | 59.5% |
| Mean | 28.7% | 24.8% |
| Median | 22.4% | 22.4% |
| Interquartile 25% (IQ1) | 18.5% | 19.9% |
| Interquartile 75% (IQ3) | 27.9% | 26.1% |
| Interquartile Range (IQR) | 9.3% | 6.2% |
| Standard Deviation (Sample) | 22.0% | 9.6% |
| Standard Deviation (Population) | 21.8% | 9.6% |
Demographics Similar to Hungarians and Norwegians by Disability Age 65 to 74
In terms of disability age 65 to 74, the demographic groups most similar to Hungarians are Czech (22.4%, a difference of 0.050%), Immigrants from Jordan (22.4%, a difference of 0.050%), Immigrants from Kazakhstan (22.4%, a difference of 0.15%), Immigrants from Western Europe (22.5%, a difference of 0.23%), and Lebanese (22.5%, a difference of 0.25%). Similarly, the demographic groups most similar to Norwegians are Immigrants from Western Europe (22.5%, a difference of 0.040%), Lebanese (22.5%, a difference of 0.060%), Slovak (22.5%, a difference of 0.17%), Czech (22.4%, a difference of 0.24%), and Immigrants from Jordan (22.4%, a difference of 0.24%).
| Demographics | Rating | Rank | Disability Age 65 to 74 |
| Syrians | 95.3 /100 | #113 | Exceptional 22.3% |
| Ukrainians | 95.1 /100 | #114 | Exceptional 22.3% |
| Laotians | 94.9 /100 | #115 | Exceptional 22.3% |
| Brazilians | 94.8 /100 | #116 | Exceptional 22.4% |
| Swedes | 94.7 /100 | #117 | Exceptional 22.4% |
| Austrians | 94.7 /100 | #118 | Exceptional 22.4% |
| Immigrants | Northern Africa | 94.7 /100 | #119 | Exceptional 22.4% |
| Immigrants | Kazakhstan | 93.9 /100 | #120 | Exceptional 22.4% |
| Czechs | 93.5 /100 | #121 | Exceptional 22.4% |
| Immigrants | Jordan | 93.5 /100 | #122 | Exceptional 22.4% |
| Hungarians | 93.3 /100 | #123 | Exceptional 22.4% |
| Norwegians | 92.5 /100 | #124 | Exceptional 22.5% |
| Immigrants | Western Europe | 92.3 /100 | #125 | Exceptional 22.5% |
| Lebanese | 92.2 /100 | #126 | Exceptional 22.5% |
| Slovaks | 91.6 /100 | #127 | Exceptional 22.5% |
| Immigrants | Costa Rica | 90.4 /100 | #128 | Exceptional 22.6% |
| Immigrants | Uruguay | 90.1 /100 | #129 | Exceptional 22.6% |
| Immigrants | Albania | 90.0 /100 | #130 | Excellent 22.6% |
| Immigrants | Nepal | 89.4 /100 | #131 | Excellent 22.6% |
| Costa Ricans | 89.2 /100 | #132 | Excellent 22.6% |
| Northern Europeans | 88.9 /100 | #133 | Excellent 22.6% |