Immigrants from Cambodia vs Portuguese Vision Disability
COMPARE
Immigrants from Cambodia
Portuguese
Vision Disability
Vision Disability Comparison
Immigrants from Cambodia
Portuguese
2.3%
VISION DISABILITY
1.1/ 100
METRIC RATING
238th/ 347
METRIC RANK
2.3%
VISION DISABILITY
4.9/ 100
METRIC RATING
218th/ 347
METRIC RANK
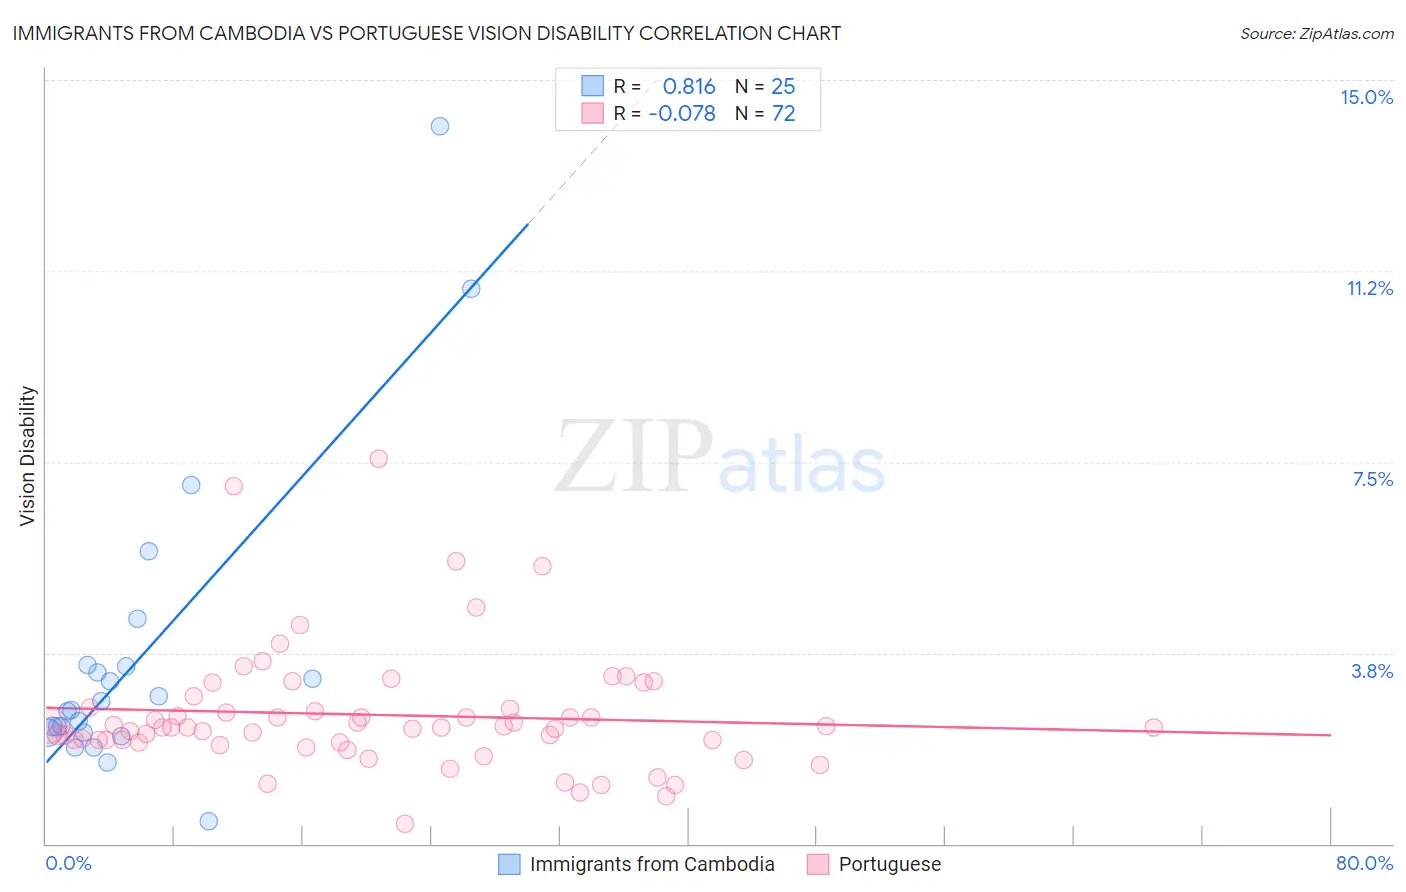
Immigrants from Cambodia vs Portuguese Vision Disability Correlation Chart
The statistical analysis conducted on geographies consisting of 205,117,517 people shows a very strong positive correlation between the proportion of Immigrants from Cambodia and percentage of population with vision disability in the United States with a correlation coefficient (R) of 0.816 and weighted average of 2.3%. Similarly, the statistical analysis conducted on geographies consisting of 449,734,569 people shows a slight negative correlation between the proportion of Portuguese and percentage of population with vision disability in the United States with a correlation coefficient (R) of -0.078 and weighted average of 2.3%, a difference of 2.3%.
Vision Disability Correlation Summary
| Measurement | Immigrants from Cambodia | Portuguese |
| Minimum | 0.43% | 0.39% |
| Maximum | 14.1% | 7.6% |
| Range | 13.7% | 7.2% |
| Mean | 3.7% | 2.5% |
| Median | 2.6% | 2.3% |
| Interquartile 25% (IQ1) | 2.2% | 2.0% |
| Interquartile 75% (IQ3) | 3.5% | 2.7% |
| Interquartile Range (IQR) | 1.3% | 0.65% |
| Standard Deviation (Sample) | 3.0% | 1.2% |
| Standard Deviation (Population) | 2.9% | 1.2% |
Demographics Similar to Immigrants from Cambodia and Portuguese by Vision Disability
In terms of vision disability, the demographic groups most similar to Immigrants from Cambodia are Immigrants from Portugal (2.3%, a difference of 0.27%), Immigrants from Congo (2.3%, a difference of 0.32%), Marshallese (2.3%, a difference of 0.41%), Scottish (2.3%, a difference of 0.48%), and Central American (2.3%, a difference of 0.66%). Similarly, the demographic groups most similar to Portuguese are Ecuadorian (2.3%, a difference of 0.11%), Guamanian/Chamorro (2.3%, a difference of 0.35%), French Canadian (2.3%, a difference of 0.36%), Immigrants from Senegal (2.3%, a difference of 0.38%), and Basque (2.3%, a difference of 0.53%).
| Demographics | Rating | Rank | Vision Disability |
| Portuguese | 4.9 /100 | #218 | Tragic 2.3% |
| Ecuadorians | 4.6 /100 | #219 | Tragic 2.3% |
| Guamanians/Chamorros | 3.9 /100 | #220 | Tragic 2.3% |
| French Canadians | 3.9 /100 | #221 | Tragic 2.3% |
| Immigrants | Senegal | 3.8 /100 | #222 | Tragic 2.3% |
| Basques | 3.5 /100 | #223 | Tragic 2.3% |
| Irish | 3.4 /100 | #224 | Tragic 2.3% |
| Immigrants | Western Africa | 3.4 /100 | #225 | Tragic 2.3% |
| Immigrants | Germany | 3.0 /100 | #226 | Tragic 2.3% |
| Hawaiians | 2.9 /100 | #227 | Tragic 2.3% |
| Hmong | 2.5 /100 | #228 | Tragic 2.3% |
| Welsh | 2.3 /100 | #229 | Tragic 2.3% |
| Nicaraguans | 2.2 /100 | #230 | Tragic 2.3% |
| Immigrants | Ecuador | 2.0 /100 | #231 | Tragic 2.3% |
| German Russians | 1.8 /100 | #232 | Tragic 2.3% |
| Central Americans | 1.8 /100 | #233 | Tragic 2.3% |
| Scottish | 1.6 /100 | #234 | Tragic 2.3% |
| Marshallese | 1.5 /100 | #235 | Tragic 2.3% |
| Immigrants | Congo | 1.4 /100 | #236 | Tragic 2.3% |
| Immigrants | Portugal | 1.4 /100 | #237 | Tragic 2.3% |
| Immigrants | Cambodia | 1.1 /100 | #238 | Tragic 2.3% |