Immigrants from Cambodia vs Cajun Family Households
COMPARE
Immigrants from Cambodia
Cajun
Family Households
Family Households Comparison
Immigrants from Cambodia
Cajuns
65.4%
FAMILY HOUSEHOLDS
99.5/ 100
METRIC RATING
85th/ 347
METRIC RANK
64.8%
FAMILY HOUSEHOLDS
89.4/ 100
METRIC RATING
132nd/ 347
METRIC RANK
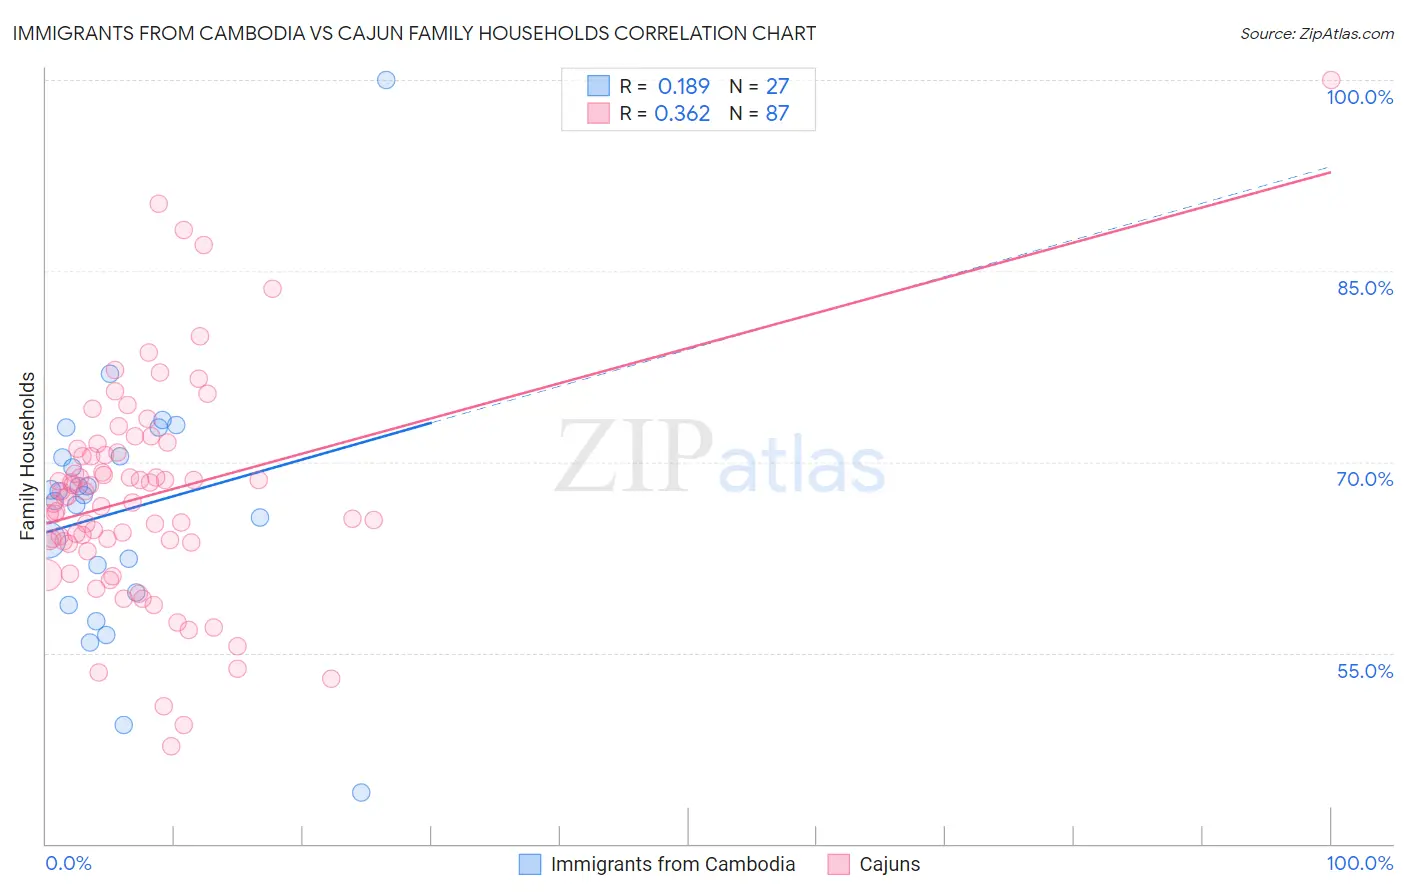
Immigrants from Cambodia vs Cajun Family Households Correlation Chart
The statistical analysis conducted on geographies consisting of 205,129,465 people shows a poor positive correlation between the proportion of Immigrants from Cambodia and percentage of family households in the United States with a correlation coefficient (R) of 0.189 and weighted average of 65.4%. Similarly, the statistical analysis conducted on geographies consisting of 149,695,707 people shows a mild positive correlation between the proportion of Cajuns and percentage of family households in the United States with a correlation coefficient (R) of 0.362 and weighted average of 64.8%, a difference of 1.0%.
Family Households Correlation Summary
| Measurement | Immigrants from Cambodia | Cajun |
| Minimum | 44.0% | 47.6% |
| Maximum | 100.0% | 100.0% |
| Range | 56.0% | 52.4% |
| Mean | 66.2% | 67.3% |
| Median | 67.4% | 67.2% |
| Interquartile 25% (IQ1) | 59.7% | 63.6% |
| Interquartile 75% (IQ3) | 70.5% | 70.7% |
| Interquartile Range (IQR) | 10.7% | 7.1% |
| Standard Deviation (Sample) | 10.2% | 8.6% |
| Standard Deviation (Population) | 10.0% | 8.6% |
Similar Demographics by Family Households
Demographics Similar to Immigrants from Cambodia by Family Households
In terms of family households, the demographic groups most similar to Immigrants from Cambodia are Egyptian (65.4%, a difference of 0.050%), American (65.5%, a difference of 0.11%), Immigrants from Lebanon (65.5%, a difference of 0.13%), Immigrants from Guyana (65.5%, a difference of 0.13%), and Immigrants from Egypt (65.3%, a difference of 0.14%).
| Demographics | Rating | Rank | Family Households |
| Yaqui | 99.8 /100 | #78 | Exceptional 65.6% |
| Immigrants | Costa Rica | 99.8 /100 | #79 | Exceptional 65.6% |
| Puget Sound Salish | 99.8 /100 | #80 | Exceptional 65.6% |
| Jordanians | 99.7 /100 | #81 | Exceptional 65.5% |
| Immigrants | Lebanon | 99.7 /100 | #82 | Exceptional 65.5% |
| Immigrants | Guyana | 99.6 /100 | #83 | Exceptional 65.5% |
| Americans | 99.6 /100 | #84 | Exceptional 65.5% |
| Immigrants | Cambodia | 99.5 /100 | #85 | Exceptional 65.4% |
| Egyptians | 99.4 /100 | #86 | Exceptional 65.4% |
| Immigrants | Egypt | 99.2 /100 | #87 | Exceptional 65.3% |
| Immigrants | Haiti | 99.1 /100 | #88 | Exceptional 65.3% |
| Immigrants | Caribbean | 99.1 /100 | #89 | Exceptional 65.3% |
| Immigrants | Laos | 99.1 /100 | #90 | Exceptional 65.3% |
| Crow | 98.9 /100 | #91 | Exceptional 65.3% |
| Hopi | 98.8 /100 | #92 | Exceptional 65.3% |
Demographics Similar to Cajuns by Family Households
In terms of family households, the demographic groups most similar to Cajuns are Belizean (64.8%, a difference of 0.0%), Nonimmigrants (64.8%, a difference of 0.020%), Immigrants from Italy (64.8%, a difference of 0.030%), Greek (64.7%, a difference of 0.040%), and Maltese (64.7%, a difference of 0.060%).
| Demographics | Rating | Rank | Family Households |
| Immigrants | Belize | 92.7 /100 | #125 | Exceptional 64.9% |
| Panamanians | 92.4 /100 | #126 | Exceptional 64.8% |
| Immigrants | Panama | 92.0 /100 | #127 | Exceptional 64.8% |
| Italians | 91.9 /100 | #128 | Exceptional 64.8% |
| Immigrants | Ecuador | 91.4 /100 | #129 | Exceptional 64.8% |
| Immigrants | Italy | 90.2 /100 | #130 | Exceptional 64.8% |
| Immigrants | Nonimmigrants | 90.1 /100 | #131 | Exceptional 64.8% |
| Cajuns | 89.4 /100 | #132 | Excellent 64.8% |
| Belizeans | 89.3 /100 | #133 | Excellent 64.8% |
| Greeks | 88.1 /100 | #134 | Excellent 64.7% |
| Maltese | 87.4 /100 | #135 | Excellent 64.7% |
| Immigrants | China | 86.6 /100 | #136 | Excellent 64.7% |
| Immigrants | Scotland | 86.4 /100 | #137 | Excellent 64.7% |
| Basques | 85.5 /100 | #138 | Excellent 64.7% |
| Immigrants | Jamaica | 85.3 /100 | #139 | Excellent 64.7% |