Immigrants from Cabo Verde vs Immigrants from Spain Disability Age 65 to 74

COMPARE

Immigrants from Cabo Verde
Race
Ancestry
AfghanAfricanAlaska NativeAlaskan AthabascanAlbanianAleutAlsatianAmericanApacheArabArapahoArgentineanArmenianAssyrian/Chaldean/SyriacAustralianAustrianBahamianBangladeshiBarbadianBasqueBelgianBelizeanBermudanBhutaneseBlackfeetBolivianBrazilianBritishBritish West IndianBulgarianBurmeseCajunCambodianCanadianCape VerdeanCarpatho RusynCelticCentral AmericanCentral American IndianCherokeeCheyenneChickasawChileanChineseChippewaChoctawColombianColvilleComancheCosta RicanCreeCreekCroatianCrowCubanCypriotCzechCzechoslovakianDanishDelawareDominicanDutchDutch West IndianEastern EuropeanEcuadorianEgyptianEnglishEstonianEthiopianEuropeanFijianFilipinoFinnishFrenchFrench American IndianFrench CanadianGermanGerman RussianGhanaianGreekGuamanian/ChamorroGuatemalanGuyaneseHaitianHmongHonduranHopiHoumaHungarianIcelanderIndian (Asian)IndonesianInupiatIranianIraqiIrishIroquoisIsraeliItalianJamaicanJapaneseJordanianKenyanKiowaKoreanLaotianLatvianLebaneseLiberianLithuanianLumbeeLuxembourgerMacedonianMalaysianMalteseMarshalleseMenomineeMexicanMexican American IndianMongolianMoroccanNative HawaiianNavajoNepaleseNew ZealanderNicaraguanNigerianNorthern EuropeanNorwegianOkinawanOsageOttawaPaiutePakistaniPalestinianPanamanianParaguayanPennsylvania GermanPeruvianPimaPolishPortuguesePotawatomiPuebloPuerto RicanPuget Sound SalishRomanianRussianSalvadoranSamoanScandinavianScotch-IrishScottishSeminoleSenegaleseSerbianShoshoneSierra LeoneanSiouxSlavicSlovakSloveneSomaliSouth AfricanSouth AmericanSouth American IndianSoviet UnionSpaniardSpanishSpanish AmericanSpanish American IndianSri LankanSubsaharan AfricanSudaneseSwedishSwissSyrianTaiwaneseThaiTlingit-HaidaTohono O'OdhamTonganTrinidadian and TobagonianTsimshianTurkishU.S. Virgin IslanderUgandanUkrainianUruguayanUteVenezuelanVietnameseWelshWest IndianYakamaYaquiYugoslavianYumanYup'ikZimbabwean
Immigration
NonimmigrantsImmigrantsAfghanistanAfricaAlbaniaArgentinaArmeniaAsiaAustraliaAustriaBahamasBangladeshBarbadosBelarusBelgiumBelizeBoliviaBosnia and HerzegovinaBrazilBulgariaBurma/MyanmarCabo VerdeCambodiaCameroonCanadaCaribbeanCentral AmericaChileChinaColombiaCongoCosta RicaCroatiaCubaCzechoslovakiaDenmarkDominicaDominican RepublicEastern AfricaEastern AsiaEastern EuropeEcuadorEgyptEl SalvadorEnglandEritreaEthiopiaEuropeFijiFranceGermanyGhanaGreeceGrenadaGuatemalaGuyanaHaitiHondurasHong KongHungaryIndiaIndonesiaIranIraqIrelandIsraelItalyJamaicaJapanJordanKazakhstanKenyaKoreaKuwaitLaosLatin AmericaLatviaLebanonLiberiaLithuaniaMalaysiaMexicoMicronesiaMiddle AfricaMoldovaMoroccoNepalNetherlandsNicaraguaNigeriaNorth AmericaNorth MacedoniaNorthern AfricaNorthern EuropeNorwayOceaniaPakistanPanamaPeruPhilippinesPolandPortugalRomaniaRussiaSaudi ArabiaScotlandSenegalSerbiaSierra LeoneSingaporeSomaliaSouth AfricaSouth AmericaSouth Central AsiaSouth Eastern AsiaSouthern EuropeSri LankaSt. Vincent and the GrenadinesSudanSwedenSwitzerlandSyriaTaiwanThailandTrinidad and TobagoTurkeyUgandaUkraineUruguayUzbekistanVenezuelaVietnamWest IndiesWestern AfricaWestern AsiaWestern EuropeYemenZaireZimbabweAzores
Immigrants from Spain
Race
Ancestry
AfghanAfricanAlaska NativeAlaskan AthabascanAlbanianAleutAlsatianAmericanApacheArabArapahoArgentineanArmenianAssyrian/Chaldean/SyriacAustralianAustrianBahamianBangladeshiBarbadianBasqueBelgianBelizeanBermudanBhutaneseBlackfeetBolivianBrazilianBritishBritish West IndianBulgarianBurmeseCajunCambodianCanadianCape VerdeanCarpatho RusynCelticCentral AmericanCentral American IndianCherokeeCheyenneChickasawChileanChineseChippewaChoctawColombianColvilleComancheCosta RicanCreeCreekCroatianCrowCubanCypriotCzechCzechoslovakianDanishDelawareDominicanDutchDutch West IndianEastern EuropeanEcuadorianEgyptianEnglishEstonianEthiopianEuropeanFijianFilipinoFinnishFrenchFrench American IndianFrench CanadianGermanGerman RussianGhanaianGreekGuamanian/ChamorroGuatemalanGuyaneseHaitianHmongHonduranHopiHoumaHungarianIcelanderIndian (Asian)IndonesianInupiatIranianIraqiIrishIroquoisIsraeliItalianJamaicanJapaneseJordanianKenyanKiowaKoreanLaotianLatvianLebaneseLiberianLithuanianLumbeeLuxembourgerMacedonianMalaysianMalteseMarshalleseMenomineeMexicanMexican American IndianMongolianMoroccanNative HawaiianNavajoNepaleseNew ZealanderNicaraguanNigerianNorthern EuropeanNorwegianOkinawanOsageOttawaPaiutePakistaniPalestinianPanamanianParaguayanPennsylvania GermanPeruvianPimaPolishPortuguesePotawatomiPuebloPuerto RicanPuget Sound SalishRomanianRussianSalvadoranSamoanScandinavianScotch-IrishScottishSeminoleSenegaleseSerbianShoshoneSierra LeoneanSiouxSlavicSlovakSloveneSomaliSouth AfricanSouth AmericanSouth American IndianSoviet UnionSpaniardSpanishSpanish AmericanSpanish American IndianSri LankanSubsaharan AfricanSudaneseSwedishSwissSyrianTaiwaneseThaiTlingit-HaidaTohono O'OdhamTonganTrinidadian and TobagonianTsimshianTurkishU.S. Virgin IslanderUgandanUkrainianUruguayanUteVenezuelanVietnameseWelshWest IndianYakamaYaquiYugoslavianYumanYup'ikZimbabwean
Immigration
NonimmigrantsImmigrantsAfghanistanAfricaAlbaniaArgentinaArmeniaAsiaAustraliaAustriaBahamasBangladeshBarbadosBelarusBelgiumBelizeBoliviaBosnia and HerzegovinaBrazilBulgariaBurma/MyanmarCambodiaCameroonCanadaCaribbeanCentral AmericaChileChinaColombiaCongoCosta RicaCroatiaCubaCzechoslovakiaDenmarkDominicaDominican RepublicEastern AfricaEastern AsiaEastern EuropeEcuadorEgyptEl SalvadorEnglandEritreaEthiopiaEuropeFijiFranceGermanyGhanaGreeceGrenadaGuatemalaGuyanaHaitiHondurasHong KongHungaryIndiaIndonesiaIranIraqIrelandIsraelItalyJamaicaJapanJordanKazakhstanKenyaKoreaKuwaitLaosLatin AmericaLatviaLebanonLiberiaLithuaniaMalaysiaMexicoMicronesiaMiddle AfricaMoldovaMoroccoNepalNetherlandsNicaraguaNigeriaNorth AmericaNorth MacedoniaNorthern AfricaNorthern EuropeNorwayOceaniaPakistanPanamaPeruPhilippinesPolandPortugalRomaniaRussiaSaudi ArabiaScotlandSenegalSerbiaSierra LeoneSingaporeSomaliaSouth AfricaSouth AmericaSouth Central AsiaSouth Eastern AsiaSouthern EuropeSpainSri LankaSt. Vincent and the GrenadinesSudanSwedenSwitzerlandSyriaTaiwanThailandTrinidad and TobagoTurkeyUgandaUkraineUruguayUzbekistanVenezuelaVietnamWest IndiesWestern AfricaWestern AsiaWestern EuropeYemenZaireZimbabweAzores
Disability Age 65 to 74
Income
Poverty
Unemployment
Labor Participation
Family Structure
Vehicle Availability
Education Level
Disability

Disability Age 65 to 74 Comparison

Immigrants from Cabo Verde

Immigrants from Spain

Tragic
Exceptional
26.3%
DISABILITY AGE 65 TO 74
0.0/ 100
METRIC RATING
290th/ 347
METRIC RANK
21.9%
DISABILITY AGE 65 TO 74
98.5/ 100
METRIC RATING
84th/ 347
METRIC RANK

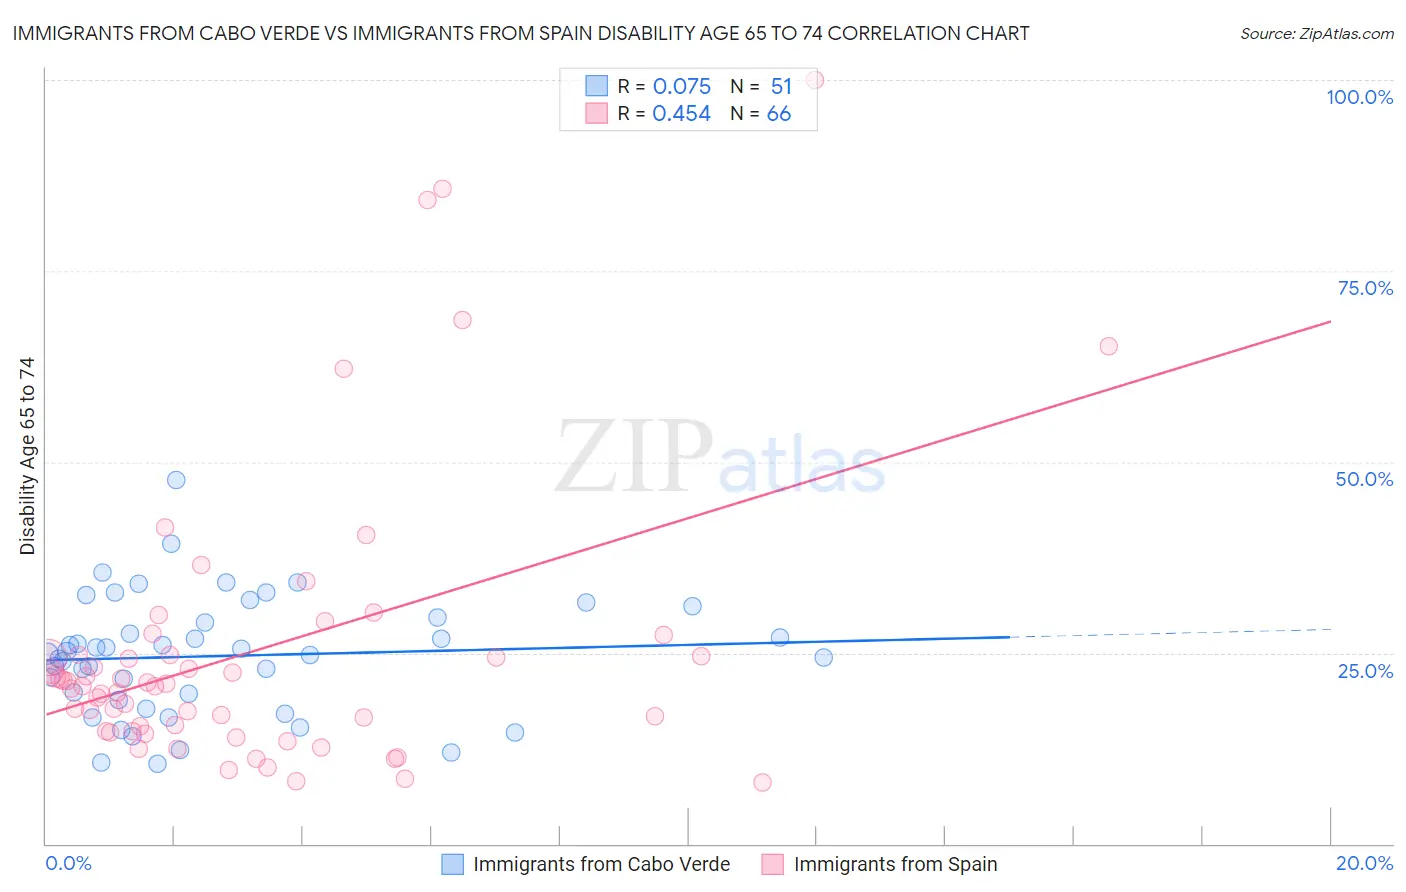
Immigrants from Cabo Verde vs Immigrants from Spain Disability Age 65 to 74 Correlation Chart

The statistical analysis conducted on geographies consisting of 38,130,720 people shows a slight positive correlation between the proportion of Immigrants from Cabo Verde and percentage of population with a disability between the ages 65 and 75 in the United States with a correlation coefficient (R) of 0.075 and weighted average of 26.3%. Similarly, the statistical analysis conducted on geographies consisting of 239,411,808 people shows a moderate positive correlation between the proportion of Immigrants from Spain and percentage of population with a disability between the ages 65 and 75 in the United States with a correlation coefficient (R) of 0.454 and weighted average of 21.9%, a difference of 20.1%.
Immigrants from Cabo Verde vs Immigrants from Spain Disability Age 65 to 74

Disability Age 65 to 74 Correlation Summary

MeasurementImmigrants from Cabo VerdeImmigrants from Spain
Minimum10.4%8.0%
Maximum47.6%100.0%
Range37.2%92.0%
Mean24.6%25.2%
Median24.8%20.8%
Interquartile 25% (IQ1)18.9%14.7%
Interquartile 75% (IQ3)29.6%24.7%
Interquartile Range (IQR)10.8%10.0%
Standard Deviation (Sample)7.8%18.6%
Standard Deviation (Population)7.7%18.5%

Similar Demographics by Disability Age 65 to 74

Demographics Similar to Immigrants from Cabo Verde by Disability Age 65 to 74

In terms of disability age 65 to 74, the demographic groups most similar to Immigrants from Cabo Verde are Spanish American Indian (26.4%, a difference of 0.20%), African (26.2%, a difference of 0.31%), Mexican American Indian (26.2%, a difference of 0.62%), Immigrants from Laos (26.1%, a difference of 0.72%), and Immigrants from Micronesia (26.1%, a difference of 0.78%).
DemographicsRating | RankDisability Age 65 to 74
Spanish Americans
0.0
/100
|
#283
Tragic
25.9%
Immigrants | Azores
0.0
/100
|
#284
Tragic
26.0%
Immigrants | Congo
0.0
/100
|
#285
Tragic
26.0%
Immigrants | Micronesia
0.0
/100
|
#286
Tragic
26.1%
Immigrants | Laos
0.0
/100
|
#287
Tragic
26.1%
Mexican American Indians
0.0
/100
|
#288
Tragic
26.2%
Africans
0.0
/100
|
#289
Tragic
26.2%
Immigrants | Cabo Verde
0.0
/100
|
#290
Tragic
26.3%
Spanish American Indians
0.0
/100
|
#291
Tragic
26.4%
Blackfeet
0.0
/100
|
#292
Tragic
26.6%
Immigrants | Central America
0.0
/100
|
#293
Tragic
26.6%
Dominicans
0.0
/100
|
#294
Tragic
26.7%
Hispanics or Latinos
0.0
/100
|
#295
Tragic
26.7%
Bangladeshis
0.0
/100
|
#296
Tragic
26.8%
Fijians
0.0
/100
|
#297
Tragic
27.0%

Demographics Similar to Immigrants from Spain by Disability Age 65 to 74

In terms of disability age 65 to 74, the demographic groups most similar to Immigrants from Spain are Immigrants from Brazil (21.9%, a difference of 0.020%), Immigrants from Lebanon (21.9%, a difference of 0.10%), South African (21.9%, a difference of 0.18%), Immigrants from Indonesia (21.9%, a difference of 0.19%), and Croatian (21.8%, a difference of 0.45%).
DemographicsRating | RankDisability Age 65 to 74
Immigrants | Poland
99.0
/100
|
#77
Exceptional
21.8%
Immigrants | Eastern Europe
99.0
/100
|
#78
Exceptional
21.8%
Venezuelans
99.0
/100
|
#79
Exceptional
21.8%
Immigrants | Norway
98.9
/100
|
#80
Exceptional
21.8%
Croatians
98.9
/100
|
#81
Exceptional
21.8%
Immigrants | Indonesia
98.7
/100
|
#82
Exceptional
21.9%
Immigrants | Brazil
98.5
/100
|
#83
Exceptional
21.9%
Immigrants | Spain
98.5
/100
|
#84
Exceptional
21.9%
Immigrants | Lebanon
98.4
/100
|
#85
Exceptional
21.9%
South Africans
98.4
/100
|
#86
Exceptional
21.9%
Australians
98.0
/100
|
#87
Exceptional
22.0%
Immigrants | Netherlands
97.9
/100
|
#88
Exceptional
22.0%
Immigrants | Kuwait
97.9
/100
|
#89
Exceptional
22.0%
Italians
97.9
/100
|
#90
Exceptional
22.0%
Chileans
97.9
/100
|
#91
Exceptional
22.0%